

Question: Question (0) QSO 320 Milestone One Guidelines and Rubric Overview Finding out about organizational inefficiencies is the first step to improving performance. To determine what
Question
(0)
QSO 320 Milestone One Guidelines and Rubric
Overview
Finding out about organizational inefficiencies is the first step to improving performance. To determine what inefficiencies exist, you need to perform a data analysis. A good place to start is with sales. You have to know what data to study and how to use specific tools for data analysis. Its important to use the IF function, pivot tables, pie charts, bar charts, and histograms. These can help you isolate specific data and organize it in a way that makes it easier to read. Studying measures of central tendency also helps you find out important information. First, you find where inefficiencies in sales exist. Then, you need to be able to talk about the effect this has on the organization.
Directions
For this assignment, youll use the Vinho Winery Scenario, linked in Supporting Materials, and other course resources to look at raw data sets. These data sets will explain the production, sales, and distribution of wine. Youll need to study the different types of wine and distribution centers to figure out their financial effects on the organizations total profits. All your analyses need to be submitted in an annotated Excel file, and each analysis needs to include your reasons for using the appropriate Excel functions.
Specifically, you must address the following rubric criteria:
- Using a pivot table, figure out the percentage of wine varieties sold from each distribution center. Show your results in the form of a pie chart.
- Hint: Create a pivot table using the data spreadsheet as a starting point.
- Create a labeled bar chart that shows the amount of wine varieties sold to each distribution center.
- Use the pivot table already created to calculate the total amount of revenue made for each distribution center. Show your results in a bar chart.
- Hint: Production cost data is provided in the Costs & Distances tab. Make sure you dont mix your units of measurement (i.e., pallets, cases, or bottles).
- Use the IF function to calculate the central tendencies (mean, median, and mode) of shipment volume for each distribution center. Show your results in a table. (Do NOT use a pivot table or manually identify each cell to be evaluated.)
- Analyze the frequency of shipment by size using a histogram. Use the following bin sizes (number of pallets): 72, 48, 24, 18, 12, 6, 3, 1.
- Create a shipment histogram to show the distribution of shipments for Portland and Riverside. Use the same bin sizes as you did in step five.
- Hint: Use the alphabetical sort for the destination column. Then select Data Analysis to plot the frequency of pallet shipments using the bin sizes listed for the two destinations separately.
- Write a summary statement that describes the inefficiencies shown in the organizational sales analysis. In your response, explain why this information is important for influencing management decisions.
(Please help with how the excel sheet should look when done)
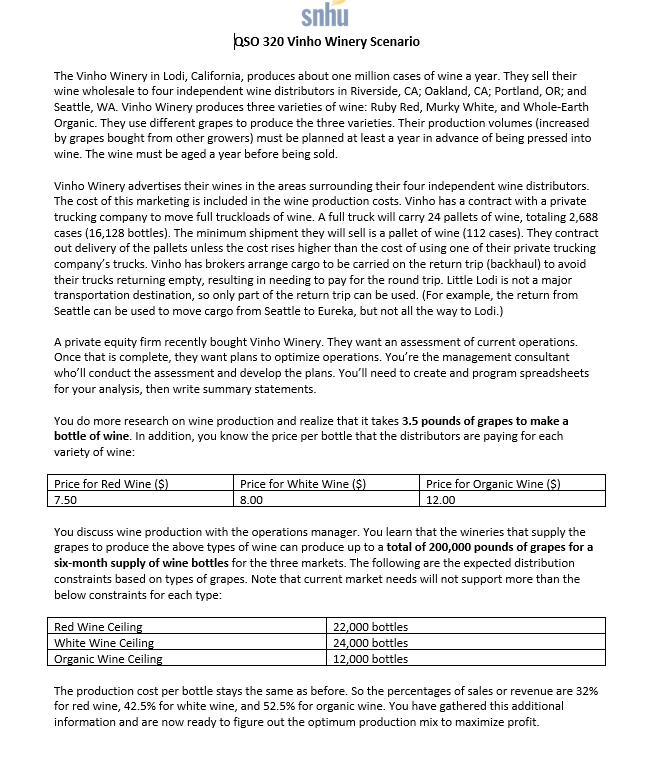
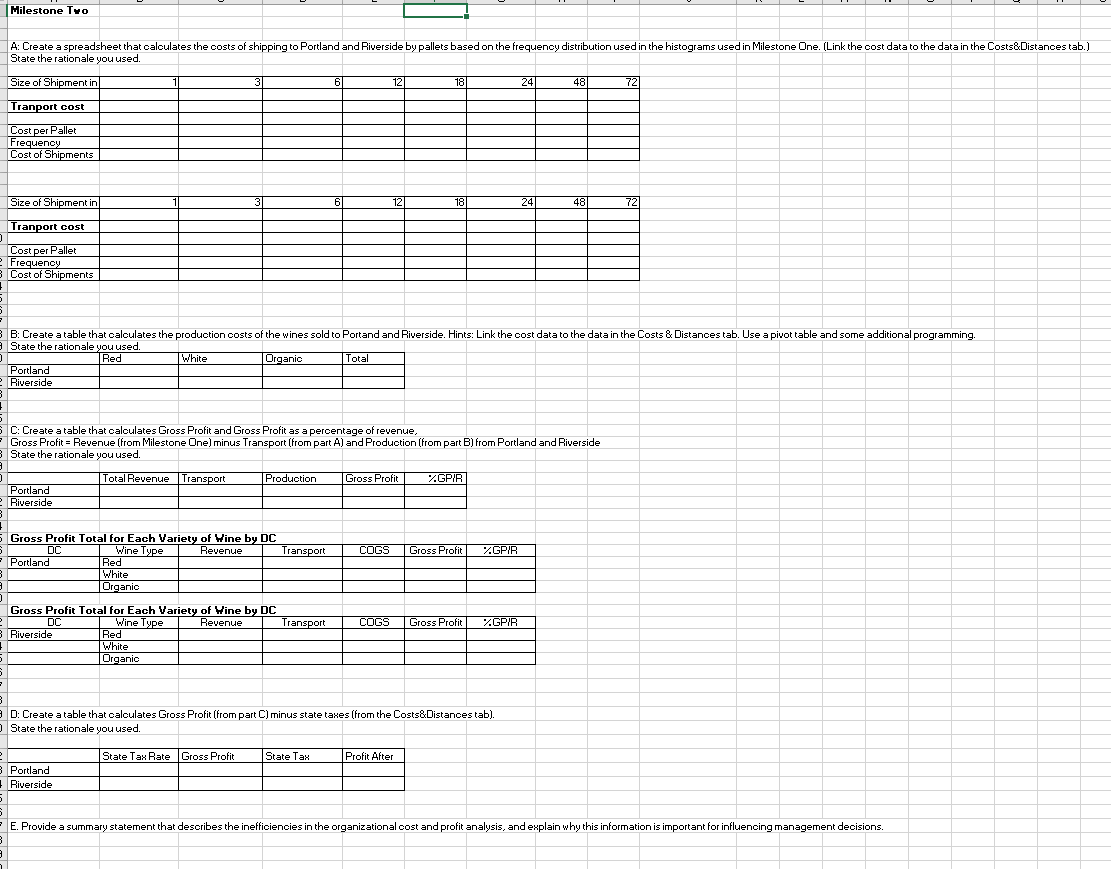
QSO 320 Vinho Winery Scenario The Vinho Winery in Lodi, California, produces about one million cases of wine a year. They sell their wine wholesale to four independent wine distributors in Riverside, CA; Oakland, CA; Portland, OR; and Seattle, WA. Vinho Winery produces three varieties of wine: Ruby Red, Murky White, and Whole-Earth Organic. They use different grapes to produce the three varieties. Their production volumes (increased by grapes bought from other growers) must be planned at least a year in advance of being pressed into wine. The wine must be aged a year before being sold. Vinho Winery advertises their wines in the areas surrounding their four independent wine distributors. The cost of this marketing is included in the wine production costs. Vinho has a contract with a private trucking company to move full truckloads of wine. A full truck will carry 24 pallets of wine, totaling 2,688 cases ( 16,128 bottles). The minimum shipment they will sell is a pallet of wine ( 112 cases). They contract out delivery of the pallets unless the cost rises higher than the cost of using one of their private trucking company's trucks. Vinho has brokers arrange cargo to be carried on the return trip (backhaul) to avoid their trucks returning empty, resulting in needing to pay for the round trip. Little Lodi is not a major transportation destination, so only part of the return trip can be used. (For example, the return from Seattle can be used to move cargo from Seattle to Eureka, but not all the way to Lodi.) A private equity firm recently bought Vinho Winery. They want an assessment of current operations. Once that is complete, they want plans to optimize operations. You're the management consultant who'll conduct the assessment and develop the plans. You'll need to create and program spreadsheets for your analysis, then write summary statements. You do more research on wine production and realize that it takes 3.5 pounds of grapes to make a bottle of wine. In addition, you know the price per bottle that the distributors are paying for each variety of wine: You discuss wine production with the operations manager. You learn that the wineries that supply the grapes to produce the above types of wine can produce up to a total of 200,000 pounds of grapes for a six-month supply of wine bottles for the three markets. The following are the expected distribution constraints based on types of grapes. Note that current market needs will not support more than the below constraints for each type: The production cost per bottle stays the same as before. So the percentages of sales or revenue are 32% for red wine, 42.5% for white wine, and 52.5% for organic wine. You have gathered this additional information and are now ready to figure out the optimum production mix to maximize profit. C: Create a table that caloulates Gross Profit and Gross Profit as a percentage of revenue, Gross Profit = Revenue (from Milestone Dne) minus Transport (from part A) and Production (from part B) from Portland and Riverside State the rationale you used. QSO 320 Vinho Winery Scenario The Vinho Winery in Lodi, California, produces about one million cases of wine a year. They sell their wine wholesale to four independent wine distributors in Riverside, CA; Oakland, CA; Portland, OR; and Seattle, WA. Vinho Winery produces three varieties of wine: Ruby Red, Murky White, and Whole-Earth Organic. They use different grapes to produce the three varieties. Their production volumes (increased by grapes bought from other growers) must be planned at least a year in advance of being pressed into wine. The wine must be aged a year before being sold. Vinho Winery advertises their wines in the areas surrounding their four independent wine distributors. The cost of this marketing is included in the wine production costs. Vinho has a contract with a private trucking company to move full truckloads of wine. A full truck will carry 24 pallets of wine, totaling 2,688 cases ( 16,128 bottles). The minimum shipment they will sell is a pallet of wine ( 112 cases). They contract out delivery of the pallets unless the cost rises higher than the cost of using one of their private trucking company's trucks. Vinho has brokers arrange cargo to be carried on the return trip (backhaul) to avoid their trucks returning empty, resulting in needing to pay for the round trip. Little Lodi is not a major transportation destination, so only part of the return trip can be used. (For example, the return from Seattle can be used to move cargo from Seattle to Eureka, but not all the way to Lodi.) A private equity firm recently bought Vinho Winery. They want an assessment of current operations. Once that is complete, they want plans to optimize operations. You're the management consultant who'll conduct the assessment and develop the plans. You'll need to create and program spreadsheets for your analysis, then write summary statements. You do more research on wine production and realize that it takes 3.5 pounds of grapes to make a bottle of wine. In addition, you know the price per bottle that the distributors are paying for each variety of wine: You discuss wine production with the operations manager. You learn that the wineries that supply the grapes to produce the above types of wine can produce up to a total of 200,000 pounds of grapes for a six-month supply of wine bottles for the three markets. The following are the expected distribution constraints based on types of grapes. Note that current market needs will not support more than the below constraints for each type: The production cost per bottle stays the same as before. So the percentages of sales or revenue are 32% for red wine, 42.5% for white wine, and 52.5% for organic wine. You have gathered this additional information and are now ready to figure out the optimum production mix to maximize profit. C: Create a table that caloulates Gross Profit and Gross Profit as a percentage of revenue, Gross Profit = Revenue (from Milestone Dne) minus Transport (from part A) and Production (from part B) from Portland and Riverside State the rationale you used
Step by Step Solution
There are 3 Steps involved in it

Get step-by-step solutions from verified subject matter experts