

Question: QUESTION 1 1. HAND CALCUALTION OR SPREADSHEET ANALYSIS. For this and the next 3 questions. Please use the following data to answer the questions that
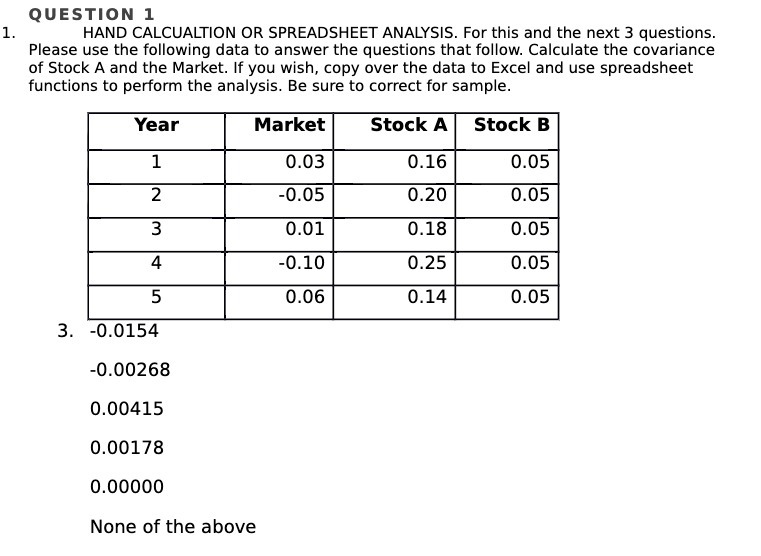
QUESTION 1 1. HAND CALCUALTION OR SPREADSHEET ANALYSIS. For this and the next 3 questions. Please use the following data to answer the questions that follow. Calculate the covariance of Stock A and the Market. If you wish, copy over the data to Excel and use spreadsheet functions to perform the analysis. Be sure to correct for sample. Year Market Stock A Stock B 1 0.03 0.16 0.05 2 -0.05 0.20 0.05 0.01 0.18 0.05 4 -0.10 0.25 0.05 UT 0.06 0.14 0.05 3. -0.0154 -0.00268 0.00415 0.00178 0.00000 None of the above
Step by Step Solution
There are 3 Steps involved in it
1 Expert Approved Answer
Step: 1 Unlock

Question Has Been Solved by an Expert!
Get step-by-step solutions from verified subject matter experts
Step: 2 Unlock
Step: 3 Unlock