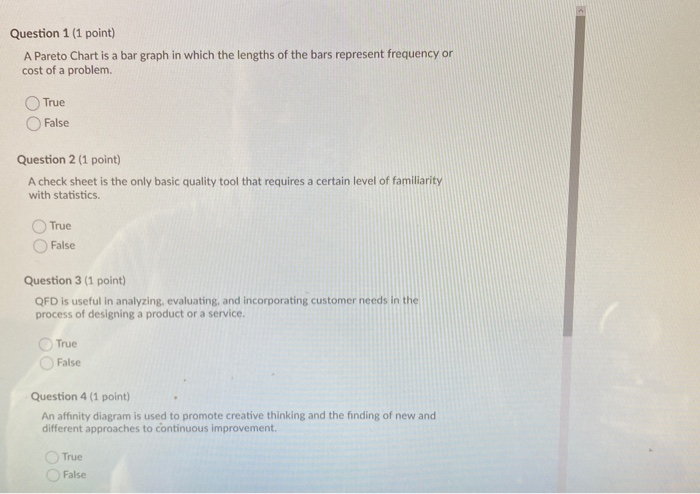
Question: Question 1 (1 point) A Pareto Chart is a bar graph in which the lengths of the bars represent frequency or cost of a problem.

Question 1 (1 point) A Pareto Chart is a bar
Question 1 (1 point) A Pareto Chart is a bar graph in which the lengths of the bars represent frequency or cost of a problem. True False Question 2 (1 point) A check sheet is the only basic quality tool that requires a certain level of familiarity with statistics. True False Question 3 (1 point) QFD is useful in analyzing, evaluating, and incorporating customer needs in the process of designing a product or a service. True False Question 4 (1 point) An affinity diagram is used to promote creative thinking and the finding of new and different approaches to continuous improvement. True False

Step by Step Solution

There are 3 Steps involved in it

1 Expert Approved Answer
Step: 1 Unlock blur-text-image
Question Has Been Solved by an Expert!

Get step-by-step solutions from verified subject matter experts

Step: 2 Unlock
Step: 3 Unlock

Students Have Also Explored These Related General Management Questions!