

Question: Question 1 (1 point) Consider the data in table below that represents the sales for one particular item for the first 9 months of the
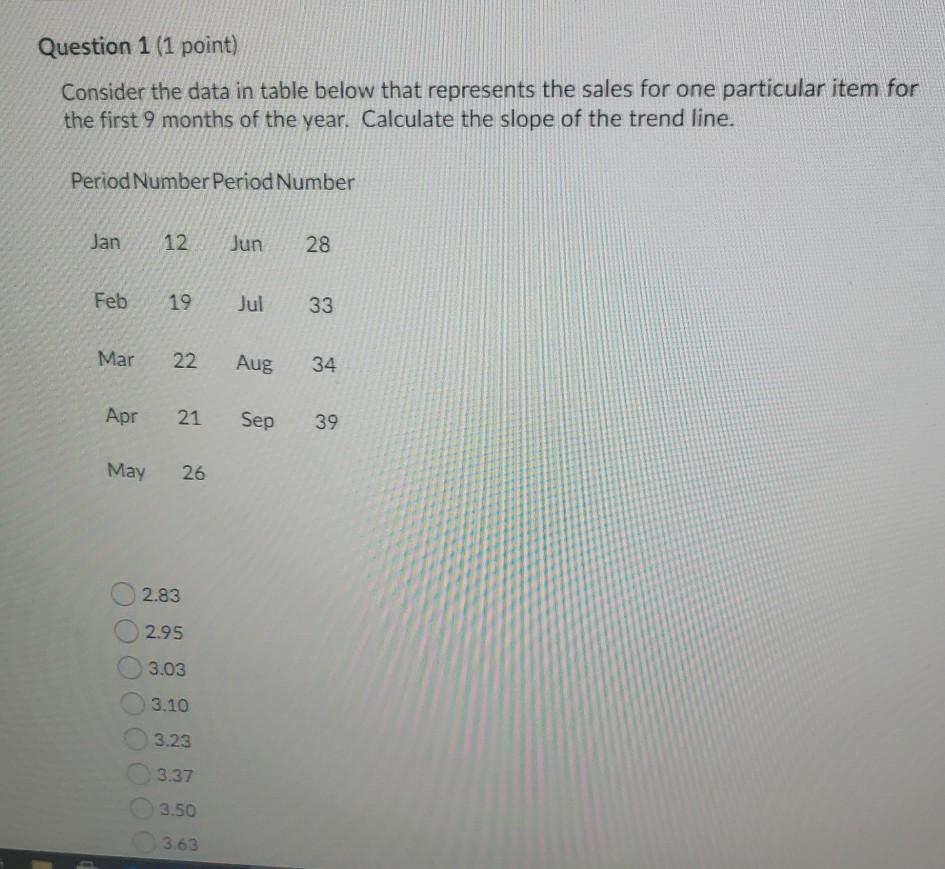
Question 1 (1 point) Consider the data in table below that represents the sales for one particular item for the first 9 months of the year. Calculate the slope of the trend line. Period Number Period Number Jan 12 Jun 28 Feb 19 Jul 33 Mar 22 Aug 34 Apr 21 Sep 39 May 26 2.83 2.95 3.03 3.10 3.23 3.37 3.50 3.63
Step by Step Solution
There are 3 Steps involved in it
1 Expert Approved Answer
Step: 1 Unlock

Question Has Been Solved by an Expert!
Get step-by-step solutions from verified subject matter experts
Step: 2 Unlock
Step: 3 Unlock