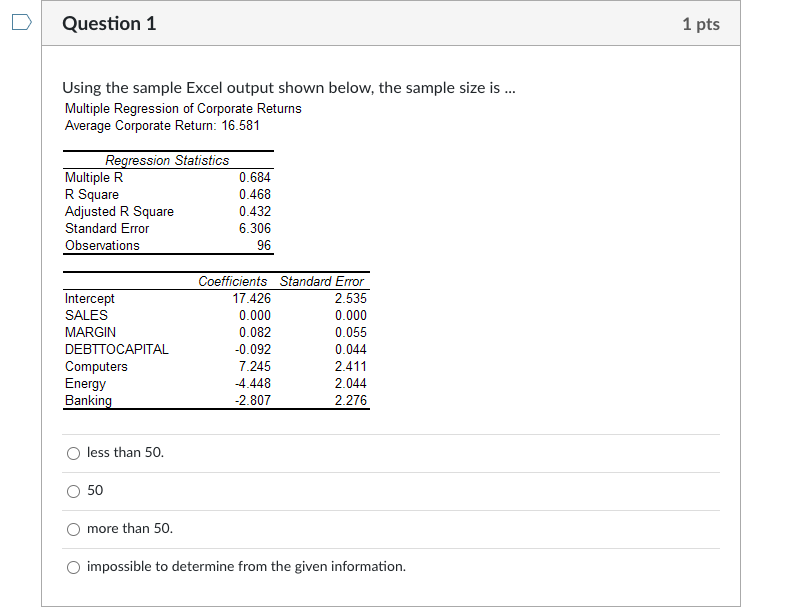
Question: Question 1 1 pts Using the sample Excel output shown below, the sample size is ... Multiple Regression of Corporate Returns Average Corporate Return: 16.581

Question 1 1 pts Using the sample Excel outputQuestion 1 1 pts Using the sample Excel outputQuestion 1 1 pts Using the sample Excel outputQuestion 1 1 pts Using the sample Excel outputQuestion 1 1 pts Using the sample Excel output

Question 1 1 pts Using the sample Excel output shown below, the sample size is ... Multiple Regression of Corporate Returns Average Corporate Return: 16.581 Regression Statistics Multiple R R Square Adjusted R Square Standard Error Observations 0.684 0.468 0.432 6.306 96 Intercept SALES MARGIN DEBTTOCAPITAL Computers Energy Banking Coefficients Standard Error 17.426 2.535 0.000 0.000 0.082 0.055 -0.092 0.044 7.245 2.411 4.448 2.044 -2.807 2.276 less than 50. 50 more than 50. impossible to determine from the given information. Consider the attached output from a multiple regression model. Which of the following statements concerning this model is most appropriate? SUMMARY OUTPUT Regression Statistics Multiple R 0.97882492 R Square 0.958098224 Adjusted R Square 0.949368688 Standard Error 20.60468091 Observations 30 ANOVA dl SS 232981.0697 F 109.7536176 MS 46596.21393 424.5528754 Significance F 1.00135E-15 Regression Residual Total 5 24 29 10189.26901 243170.3387 Intercept X1 X2 X3 X4 X5 Coefficients -36.3270494 0.16929855 6.914049028 17.48504438 -0.039389609 -1.335747197 Standard Error 1 Stat 36.75958962 -0.988233269 0.015790089 10.72182381 1.469015764 4.706586 9.942233366 1.758663646 0.074287836 -0.530229592 1.365579884 -0.978153832 P-value 0.332897517 1.23882E-10 8.7566E-05 0.09138111 0.600824678 0.337755843 Lower 95% -112.195113 0.136709409 3.882149527 -3.034716617 -0.192712166 -4.154165536 Upper 95% 39.54101422 0.201887692 9.945948529 38.00480538 0.113932948 1.482671142 The overall model is statistically significant and some, but not all of the individual predictors are statistically significant. The overall model is statistically significant and every individual predictor is statistically significant. The overall model is not statistically significant and some, but not all, of the individual predictors are statistically significant The overall model is statistically significant, but none of the individual predictors are statistically significant The overall model is not statistically significant and none of the individual predictors are statistically significant Question 3 1 pts Assume exponential smoothing is being used to forecast demand. The most recent forecast of 66 turned out to be six units less than actual demand. The next period forecast is 66.9, implying a smoothing constant (alpha) equal to: .60 .10 .15 .01 .20 Question 4 1 pts Given the following information, calculate the MAE. Y Forecast 12 15 20 20 15 12 O 5 Some other number. 50% Question 5 1 pts For the following set of forecast errors: -1, -4, 0, +2, +3, the Average Error is: 6.0 10.0 O 1.0 0.0 o 2.0

Step by Step Solution

There are 3 Steps involved in it

1 Expert Approved Answer
Step: 1 Unlock blur-text-image
Question Has Been Solved by an Expert!

Get step-by-step solutions from verified subject matter experts

Step: 2 Unlock
Step: 3 Unlock

Students Have Also Explored These Related General Management Questions!