

Question: QUESTION 1 1. Which investment has yielded the highest return since 1926? Treasury Bills Small Stocks Large Stocks Government Bonds 10 points QUESTION 2 2.
QUESTION 1
1. Which investment has yielded the highest return since 1926?
| Treasury Bills | ||
| Small Stocks | ||
| Large Stocks | ||
| Government Bonds |
10 points
QUESTION 2
2. Which investment has yielded the lowest return since 1926?
| Treasury Bills | ||
| Government Bonds | ||
| Large Stocks | ||
| Small Stocks |
10 points
QUESTION 3
3. Based on what we've learned about risk and return, which investment is likely the lowest risk option on the chart (hint: if you do not remember what inflation is, look it up first)?
| Inflation | ||
| Government Bonds | ||
| Treasury Bills | ||
| Large Stocks |
10 points
QUESTION 4
4. Based on what we've learned about risk and return, which investment is likely the highest risk option on the chart (hint: if you do not remember what inflation is, look it up first)?
| Inflation | ||
| Small Stocks | ||
| Large Stocks | ||
| Government Bonds |
10 points
QUESTION 5
5. One of the lines on the chart tracks a non-investment item: inflation. Why do you think this is important to include?
| You can add the return on inflation to your return on investment for an even higher return! | ||
| Inflation measures how much your salary rises per year, so this helps understand how both your salary and investments are rising. | ||
| It is not important, it is just something economists watch because it affects their projections. | ||
| If your investment earns a positive return, but it is less than the inflation rate, then your money is actually losing value and you are losing purchasing power. |
10 points
QUESTION 6
6. The Annualized Return for Small Stocks as compared to Large Stocks is only 2% ( 12% vs. 10%). Yet, when you look at the growth of $1 since 1926, the return for Small Stocks is almost 5 times greater than Large Stocks. Why?
| Because the stocks are small, there are more of them leading to more money per stock. | ||
| The owners of the small stocks did a lot more day trading leading to higher returns on an annual basis. | ||
| The extra 2% is compounded over the course of so many years leading to this gap between the returns for small stocks and large stocks. | ||
| When you subtract the return for large stocks from the return of small stocks and divide by the difference between the interest rates, it results in exactly 2%. |
10 points
QUESTION 7
7. Which investment from the chart has the most volatile history representing the highest risk?
| Small Stocks | ||
| Large Stocks | ||
| Government Bonds | ||
| Treasury Bills |
Please Help
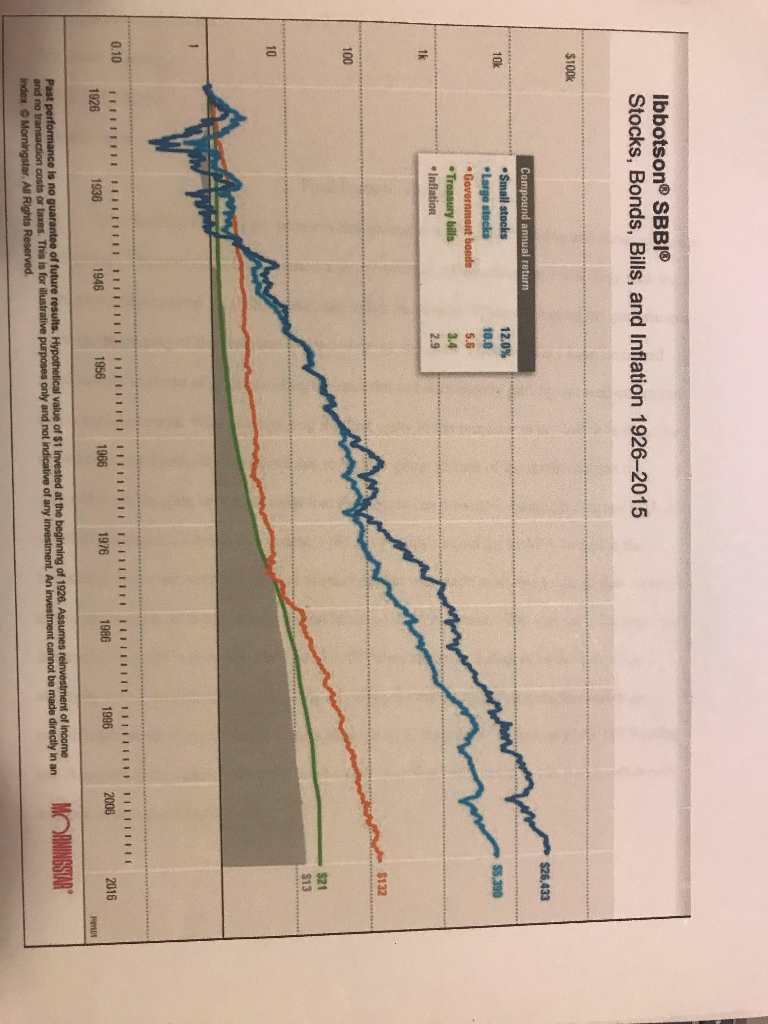
Ibbotson SBBI Stocks, Bonds, Bills, and Inflation 19262015 $100K $26.433 10k Compound annual return Small stocks Large stocks . Government bonde Treasury bills Inflation 12.0% 10.0 5.6 29 100 $132 10 $21 $13 0.10 1926 1938 1946 1956 1966 1976 1986 1996 2006 2016 Past performance is no guarantee of future results. Hypothetical value of $1 invested at the beginning of 1926. Assumes reinvestment of income and no transaction costs or takes. This is for strative purposes only and not indicative of any investment. An investment cannot be made directly in an index Morningstar. All Rights Reserved. MORNINGSTAR
Step by Step Solution
There are 3 Steps involved in it

Get step-by-step solutions from verified subject matter experts