

Question: Returns are in figure 1 above. Please help solve the problem. Figure 1: Growth of $1 from 1926 to 2017 bbotson SBBI Stocks, bonds, bills,
Returns are in figure 1 above. Please help solve the problem.
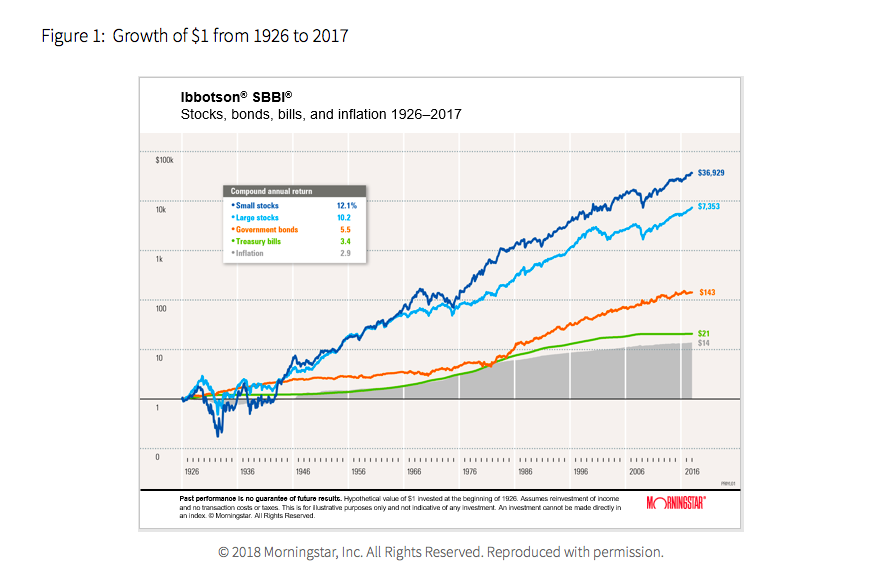
Figure 1: Growth of $1 from 1926 to 2017 bbotson SBBI Stocks, bonds, bills, and inflation 1926-2017 36.929 Compound annual return Small stocks Large stocks Government bonds Treasury bills Inflation 12.1% 10.2 $7,353 3.4 2.9 $143 100 $21 $14 1976 1926 1946 956 1966 1995 2016 Past performanoe i& no guarantee of future recultt. Hypcthetical value of $1 inwested at the beginning of 1928. Assumes reinvestment of income and no transaction ooats or taes This is for Iustrative purposes onily and not ind cative of any investment. An nwestment cannot be made drectly in an index Momingstar. AI Rights Reserved O 2018 Morningstar, Inc. All Rights Reserved. Reproduced with permission. Practice4 Homework Unanswered Using the returns in Figure 1, calculate the risk premium on long-term government bonds. (Enter only numbers and decimals in your response. Round to 2 decimal places.) Numeric
Step by Step Solution
There are 3 Steps involved in it

Get step-by-step solutions from verified subject matter experts