

Question: Question 1 (10 points): TABLE 2.1 Data for the mass and associated terminal velocities of a number of jumpers. m, kg 83.6 60.2 72.1 91.1
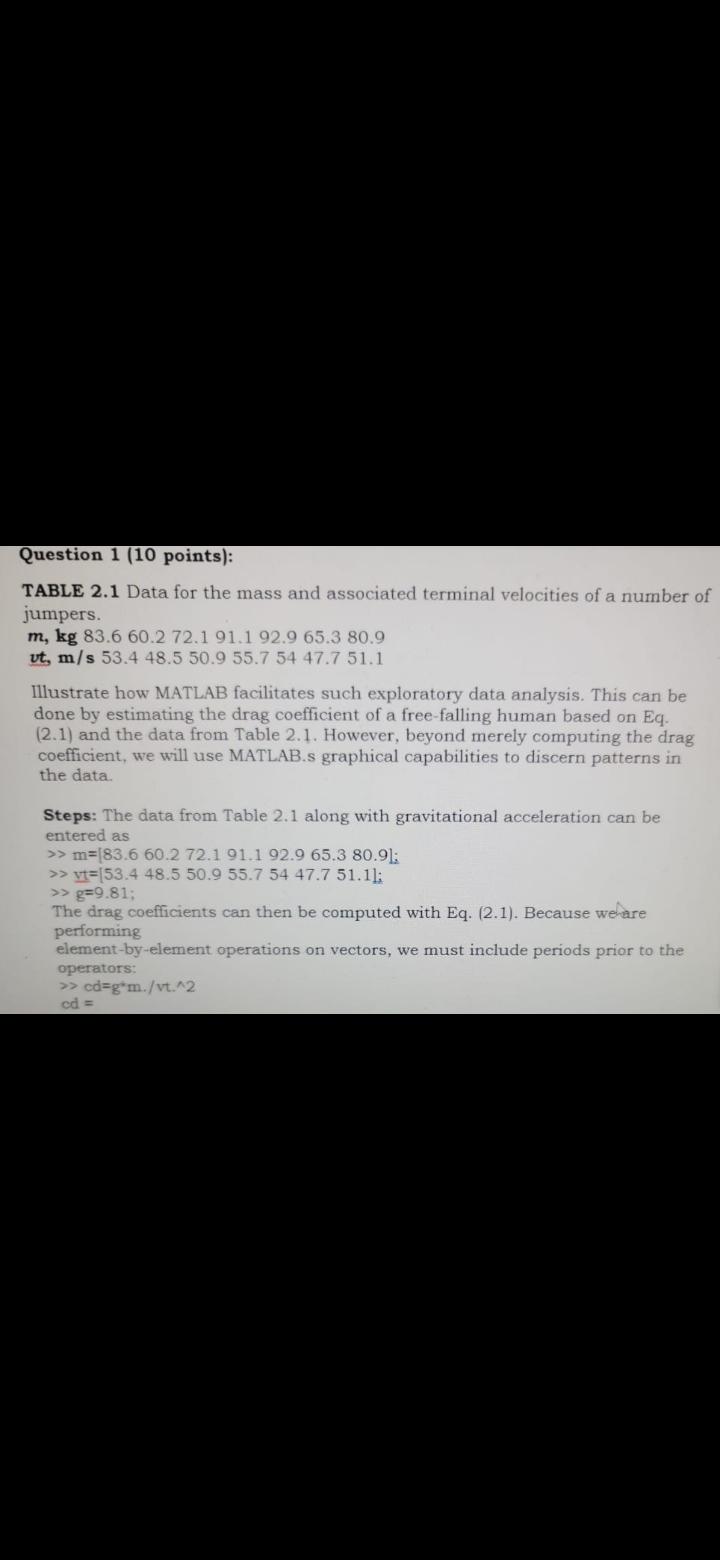
Question 1 (10 points): TABLE 2.1 Data for the mass and associated terminal velocities of a number of jumpers. m, kg 83.6 60.2 72.1 91.1 92.9 65.3 80.9 ut, m/s 53.4 48.5 50.9 55.7 54 47.7 51.1 Illustrate how MATLAB facilitates such exploratory data analysis. This can be done by estimating the drag coefficient of a free-falling human based on Eq. (2.1) and the data from Table 2.1. However, beyond merely computing the drag coefficient, we will use MATLAB.s graphical capabilities to discern patterns in the data. Steps: The data from Table 2.1 along with gravitational acceleration can be entered as >> m=[83.6 60.2 72.1 91.1 92.9 65.3 80.91: >> vt=[53.4 48.5 50. 55.7 54 47.7 51.11: >> g=9.81; The drag coefficients can then be computed with Eq. (2.1). Because we are performing element-by-element operations on vectors, we must include periods prior to the operators: >> cd=gim./vt.2 cd =
Step by Step Solution
There are 3 Steps involved in it

Get step-by-step solutions from verified subject matter experts