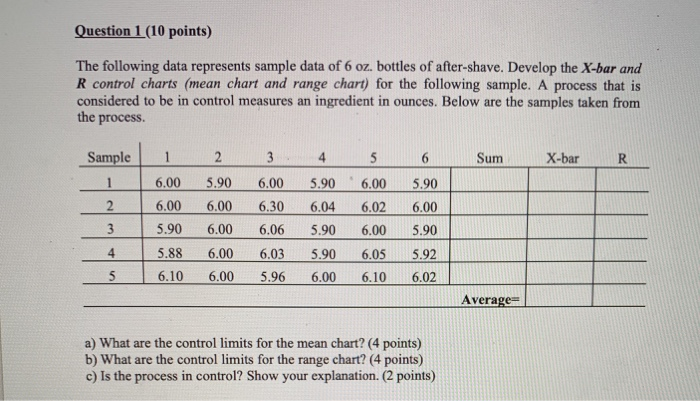
Question: Question 1 (10 points) The following data represents sample data of 6 oz. bottles of after-shave. Develop the X-bar and R control charts (mean chart

Question 1 (10 points) The following data
Question 1 (10 points) The following data represents sample data of 6 oz. bottles of after-shave. Develop the X-bar and R control charts (mean chart and range chart) for the following sample. A process that is considered to be in control measures an ingredient in ounces. Below are the samples taken from the process. Sum X-bar R Sample 1 2 6 1 .00 6.00 5.90 5.88 6.10 2 5.90 6.00 6.00 6.00 6.00 3 6.00 6.30 6.06 6.03 5.96 4 5 5.906.00 6.04 6.02 5.90 6.00 5.90 6.05 6.00 6.10 6 5.90 6.00 5.90 5.92 6.02 IA Average= a) What are the control limits for the mean chart? (4 points) b) What are the control limits for the range chart? (4 points) c) Is the process in control? Show your explanation. (2 points)

Step by Step Solution

There are 3 Steps involved in it

1 Expert Approved Answer
Step: 1 Unlock blur-text-image
Question Has Been Solved by an Expert!

Get step-by-step solutions from verified subject matter experts

Step: 2 Unlock
Step: 3 Unlock

Students Have Also Explored These Related General Management Questions!