

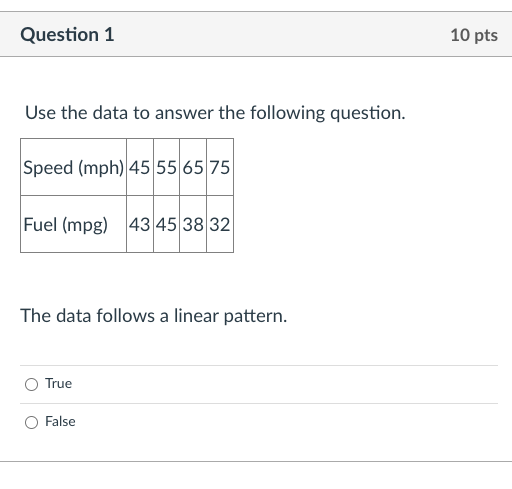
Question: Question 1 10 pts Use the data to answer the following question. Speed (mph) 45 55 65 75 Fuel (mpg) 43 45 38 32 The


![Use the data to answer the following questions. Speed [mph] Fuel [n1](https://s3.amazonaws.com/si.experts.images/answers/2024/06/667cc98c14dd1_092667cc98c033ba.jpg)

![to answer the following questions. Speed [mph] Fuel [n1 pg] Find the](https://s3.amazonaws.com/si.experts.images/answers/2024/06/667cc98d572cd_093667cc98d399cd.jpg)

![data to answer the following questions. Speed [mph] Fuel [m pg] Is](https://s3.amazonaws.com/si.experts.images/answers/2024/06/667cc98eac7c1_094667cc98e977a6.jpg)
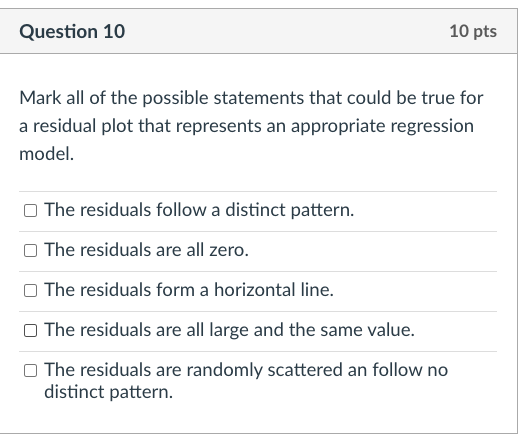
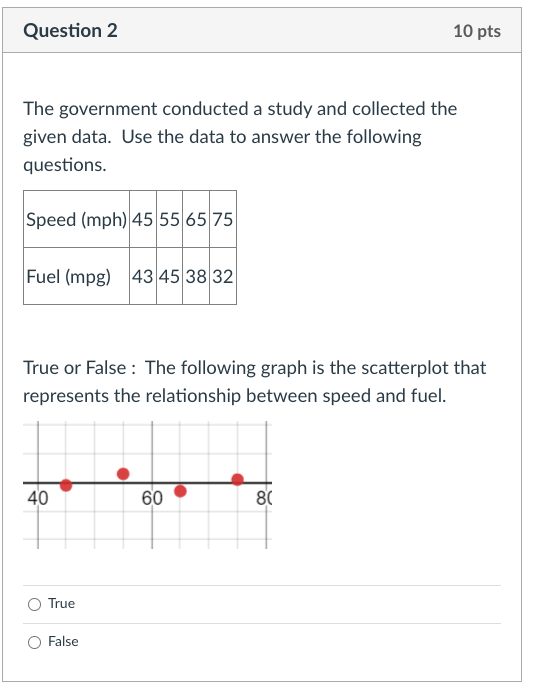
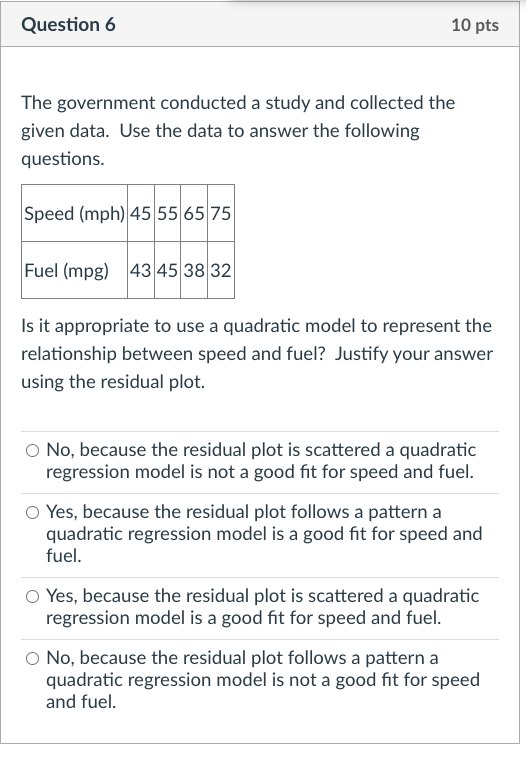
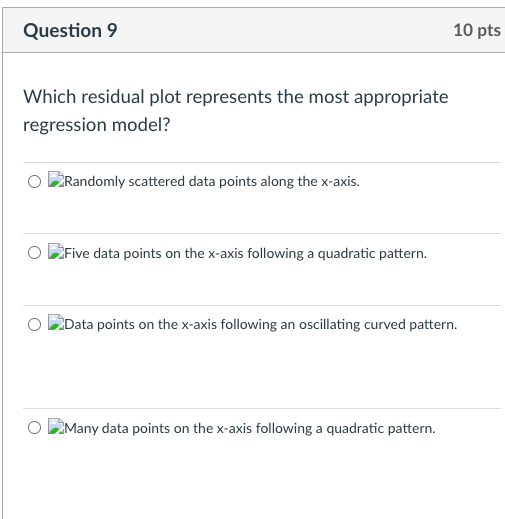
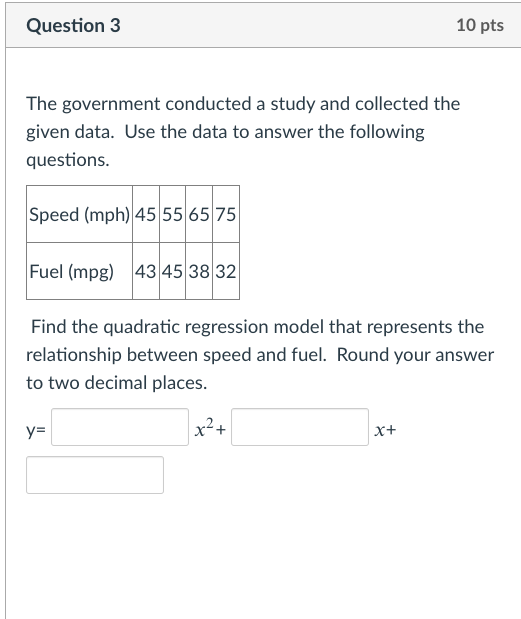
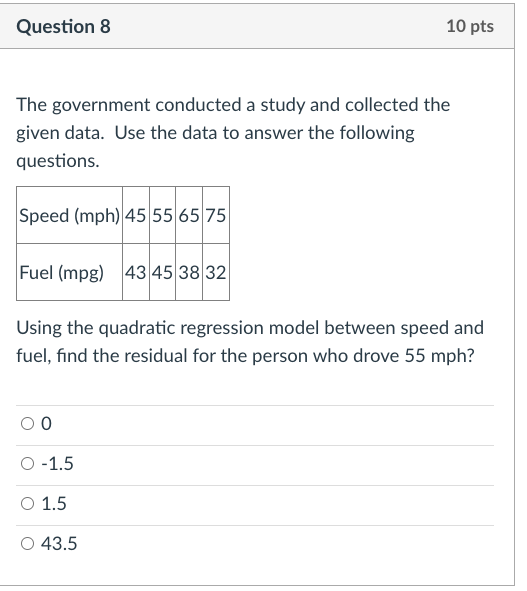
Question 1 10 pts Use the data to answer the following question. Speed (mph) 45 55 65 75 Fuel (mpg) 43 45 38 32 The data follows a linear pattern. O True O FalseQuestion 2 113 pts The government conducted a study and collected the given data. Use the data to answer the following questions. Speed [mph] Fuel [n1 pg) True or False : The following graph is the seatterplot that represents the relationship between speed and fuel. Question 3 10 pts The government conducted a study and collected the given data. Use the data to answer the following questions. Speed [mph] Fuel [n1 pg] Find the quadratic regression model that represents the relationship between speed and fuel. Round 1your answer to two decimal places. a |x2+| Question 6 10 pts The government conducted a study and collected the given data. Use the data to answer the following questions. Speed [mph] Fuel [m pg] Is it appropriate to use a quadratic model to represent the relationship between speed and fuel? Justify your answer using the residual plot. C: No. because the residual plot is scattered a quadratic regression model is net a good t for speed and fuel. C: Yes. because the residual plot follows a pattern a quadratic regression model is a good t for speed and fuel. C: Yes. because the residual plot is scattered a quadratic regression model is a good fit for speed and fuel. C: No. because the residual plot follows a pattern a quadratic regression model is not a good fit for speed andfueL Question 3 10 pts The government conducted a study and collected the given data. Use the data to answer the following questions. Speed [mph] Fuel [n1 pg] Using the quadratic regression model between speed and fuel, nd the residual for the person who drove 55 mph? D D G -1.5 D 1.5 D 43.5 Question 9 10 pts Which residual plot represents the most appropriate regression model? Randomly scattered data points along the x-axis. O Five data points on the x-axis following a quadratic pattern. O Data points on the x-axis following an oscillating curved pattern. O Many data points on the x-axis following a quadratic pattern.Question 10 10 pts Mark all of the possible statements that could be true for a residual plot that represents an appropriate regression model. O The residuals follow a distinct pattern. O The residuals are all zero. O The residuals form a horizontal line. The residuals are all large and the same value. O The residuals are randomly scattered an follow no distinct pattern
Step by Step Solution
There are 3 Steps involved in it

Get step-by-step solutions from verified subject matter experts