

Question: Question 1 (100 points) : As you know, a process can have one of two types of problems. First, it can be out of control.
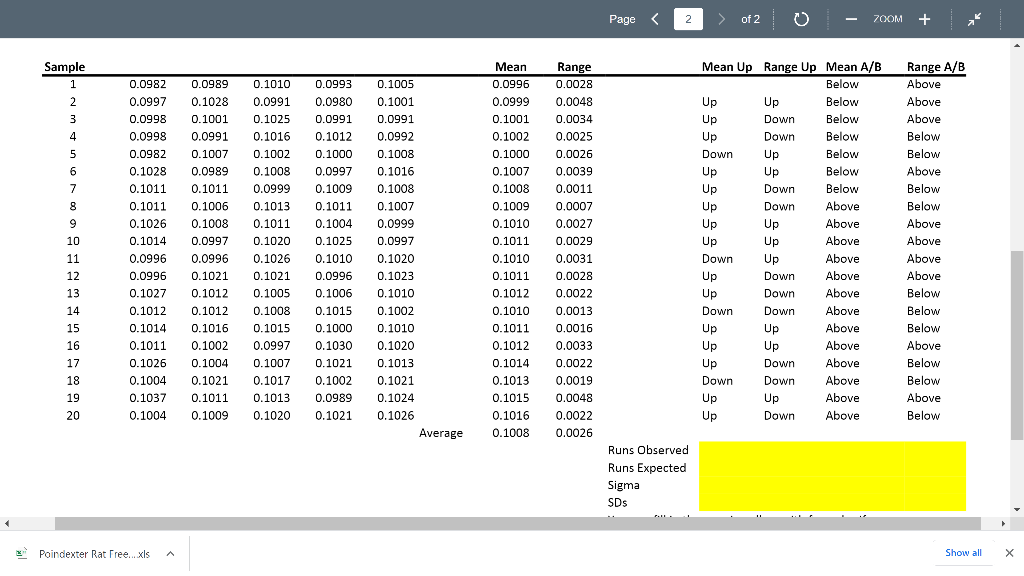
Question 1 (100 points): As you know, a process can have one of two types of problems. First, it can be out of control. Second, if it is under control, it still may not be good enough. Which data set should be used to see if the process is out of control? Answer this question by only writing two words: either dataset one or dataset two. Dataset One
Question 2 (100 points): Does the first dataset prove that either of those problems existed two months ago? If so, which type of problem? Answer in 50 words or fewer. Also show whatever calculations or charts you used to answer the question. Note: You will not get any points for unsupported answers so you will need to have some calculations or charts to support your answer.
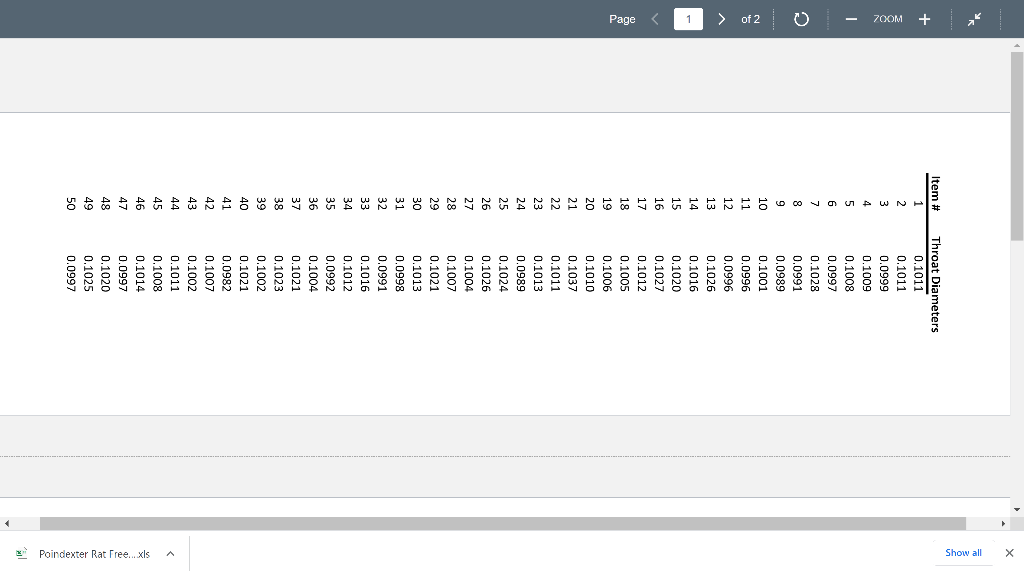
Question 3 (100 points): Does the second dataset prove that either of those problems existed a week ago? If so, which type? Answer in 50 words or fewer and, once again, show whatever calculations or charts you find necessary to answer the question. Again, unsupported answers will not receive any points.
Question 4 (100 points): Your answer to one of the last two questions will require drawing a chart or two. Which question required you to draw a chart(s)? Why was a chart necessary? Answer in 50 words or fewer.
Question 5 (100 points): Say which of the following is true at present (starting a week ago) and then say why it is true. Only one of the four is true right now so only pick one. Answer using 50 words or fewer.
- The process is presently under control, and is good enough.
- The process is presently under control, but not good enough.
- The process is not under control now, but was good enough when it was under control two months ago.
- The process is not under control now, and it wasnt good enough when it was under control two months ago.
You have all the data you need to answer the questions. Any number you need can either be calculated from the ones you have been given or is a matter of managerial discretion (in which case you need to pick a number that makes sense). For example, if you need to come up with a cutoff number for a particular test and it isnt given, then you need to decide what it should be. In that case make sure to tell me what number you picked. Specifically, maybe 3 standard deviations makes sense for a cutoff; or maybe an industry standard number makes sense. You decide. Hint: If there is an industry standard number youll probably find it in the text, right?
If you need a number that can be calculated (like a standard deviation, average, average of averages, average of ranges, etc.) you may calculate it by hand or have excel calculate it for you. If you calculate a standard deviation or average etc., make sure it is the right one. Remember that the standard deviation of a process is larger than the standard deviation of sample averages from that process, so it makes a difference which standard deviations you calculate.
In answering one of the questions you will have your choice of formulas to use. You can pick whichever set of formulas you prefer since any set should give you the same result. In fact, a good way to check your work would be to do your calculations using more than one formula to see if you get the same answer.
Page of2 | 0 ZOOM + 0.0993 Sample 1 2 3 4 0.0982 0.0997 0.0998 0.0998 5 6 7 8 9 10 11 12 13 14 15 16 17 18 19 20 0.0982 0.1028 0.1011 0.1011 0.1026 0.1014 0.0996 0.0996 0.1027 0.1012 0.1014 0.1011 0.1026 0.1004 0.1037 0.1004 0.0989 0.1028 0.1001 0.0991 0.1007 0.0989 0.1011 0.1006 0.1008 0.0997 0.0996 0.1021 0.1012 0.1012 0.1016 0.1002 0.1004 0.1021 0.1011 0.1009 0.1010 0.0991 0.1025 0.1016 0.1002 0.1008 0.0999 0.1013 0.1011 0.1020 0.1026 0.1021 0.1005 0.1008 0.1015 0.0997 0.1007 0.1017 0.1013 0.1020 0.0980 0.0991 0.1012 0.1000 0.0997 0.1009 0.1011 0.1004 0.1025 0.1010 0.0996 0.1006 0.1015 0.1000 0.1030 0.1021 0.1002 0.0989 0.1021 0.1005 0.1001 0.0991 0.0992 0.1008 0.1016 0.1008 0.1007 0.0999 0.0997 0.1020 0.1023 0.1010 0.1002 0.1010 0.1020 0.1013 0.1021 0.1024 0.1026 Mean 0.0996 0.0999 0.1001 0.1002 0.1000 0.1007 0.1008 0.1009 0.1010 0.1011 0.1010 0.1011 0.1012 0.1010 0.1011 0.1012 0.1014 0.1013 0.1015 0.1016 0.1008 Range 0.0028 0.0048 0.0034 0.0025 0.0026 0.0039 0.0011 0.0007 0.0027 0.0029 0.0031 0.0028 0.0022 0.0013 0.0016 0.0033 0.0022 0.0019 0.0048 0.0022 0.0026 $$$$$$$$$$$$$7585 Mean Up Range Up Mean A/B Below Up Up Below Up Down Below Up Down Below Down Up Below Up Up Below Up Down Below Up Down Above Up Up Above Up Up Above Down Up Above Up Down Above Up Down Above Down Down Above Up Up Above Up Up Above Up Down Above Down Down Above Up Up Above Up Down Above Range A/B Above Above Above Below Below Above Below Below Above Above Above Above Below Below Below Above Below Below Above Below Average Runs Observed Runs Expected Sigma SDs Poindexter Rat Free....xls Show all X Show all X > of 20 - ZOOM + Item # 1 2 3 4 5 6 7 8 9 10 11 12 13 14 15 16 17 18 19 20 21 22 23 24 25 26 27 28 29 30 31 32 33 34 35 36 Throat Diameters 0.1011 0.1011 0.0999 0.1009 0.1008 0.0997 0.1028 0.0991 0.0989 0.1001 0.0996 0.0996 0.1026 0.1016 0.1020 0.1027 0.1012 0.1005 0.1006 0.1010 0.1037 0.1011 0.1013 37 0.0989 0.1024 0.1026 0.1004 0.1007 0.1021 0.1013 0.0998 0.0991 0.1016 0.1012 0.0992 0.1004 0.1021 0.1023 0.1002 0.1021 0.0982 0.1007 0.1002 0.1011 0.1008 0.1014 0.0997 0.1020 0.1025 0.0997 39 40 41 42 43 44 45 46 47 48 49 50 Poindexter Page of2 | 0 ZOOM + 0.0993 Sample 1 2 3 4 0.0982 0.0997 0.0998 0.0998 5 6 7 8 9 10 11 12 13 14 15 16 17 18 19 20 0.0982 0.1028 0.1011 0.1011 0.1026 0.1014 0.0996 0.0996 0.1027 0.1012 0.1014 0.1011 0.1026 0.1004 0.1037 0.1004 0.0989 0.1028 0.1001 0.0991 0.1007 0.0989 0.1011 0.1006 0.1008 0.0997 0.0996 0.1021 0.1012 0.1012 0.1016 0.1002 0.1004 0.1021 0.1011 0.1009 0.1010 0.0991 0.1025 0.1016 0.1002 0.1008 0.0999 0.1013 0.1011 0.1020 0.1026 0.1021 0.1005 0.1008 0.1015 0.0997 0.1007 0.1017 0.1013 0.1020 0.0980 0.0991 0.1012 0.1000 0.0997 0.1009 0.1011 0.1004 0.1025 0.1010 0.0996 0.1006 0.1015 0.1000 0.1030 0.1021 0.1002 0.0989 0.1021 0.1005 0.1001 0.0991 0.0992 0.1008 0.1016 0.1008 0.1007 0.0999 0.0997 0.1020 0.1023 0.1010 0.1002 0.1010 0.1020 0.1013 0.1021 0.1024 0.1026 Mean 0.0996 0.0999 0.1001 0.1002 0.1000 0.1007 0.1008 0.1009 0.1010 0.1011 0.1010 0.1011 0.1012 0.1010 0.1011 0.1012 0.1014 0.1013 0.1015 0.1016 0.1008 Range 0.0028 0.0048 0.0034 0.0025 0.0026 0.0039 0.0011 0.0007 0.0027 0.0029 0.0031 0.0028 0.0022 0.0013 0.0016 0.0033 0.0022 0.0019 0.0048 0.0022 0.0026 $$$$$$$$$$$$$7585 Mean Up Range Up Mean A/B Below Up Up Below Up Down Below Up Down Below Down Up Below Up Up Below Up Down Below Up Down Above Up Up Above Up Up Above Down Up Above Up Down Above Up Down Above Down Down Above Up Up Above Up Up Above Up Down Above Down Down Above Up Up Above Up Down Above Range A/B Above Above Above Below Below Above Below Below Above Above Above Above Below Below Below Above Below Below Above Below Average Runs Observed Runs Expected Sigma SDs Poindexter Rat Free....xls Show all X Show all X > of 20 - ZOOM + Item # 1 2 3 4 5 6 7 8 9 10 11 12 13 14 15 16 17 18 19 20 21 22 23 24 25 26 27 28 29 30 31 32 33 34 35 36 Throat Diameters 0.1011 0.1011 0.0999 0.1009 0.1008 0.0997 0.1028 0.0991 0.0989 0.1001 0.0996 0.0996 0.1026 0.1016 0.1020 0.1027 0.1012 0.1005 0.1006 0.1010 0.1037 0.1011 0.1013 37 0.0989 0.1024 0.1026 0.1004 0.1007 0.1021 0.1013 0.0998 0.0991 0.1016 0.1012 0.0992 0.1004 0.1021 0.1023 0.1002 0.1021 0.0982 0.1007 0.1002 0.1011 0.1008 0.1014 0.0997 0.1020 0.1025 0.0997 39 40 41 42 43 44 45 46 47 48 49 50 Poindexter
Step by Step Solution
There are 3 Steps involved in it

Get step-by-step solutions from verified subject matter experts