

Question: QUESTION 1 1.1 Describe the basic assumptions made when deigning simple flow lines. (8) 1.2 The diagram below shows the precedence relationships of work elements
QUESTION 1
1.1 Describe the basic assumptions made when deigning simple flow lines. (8)
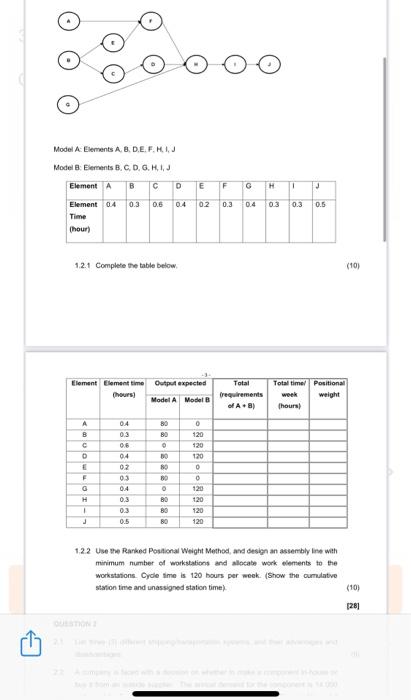
1.2 The diagram below shows the precedence relationships of work elements which constitute two models (A and B) of a simple product. The assembly line for the two models must be designed for a mixed production line. Certain elements are common to both models. The outputs required for the two models per week are: Model A = 80 units and Model B = 120 units:
Model A: Elements A, B, D,E, F, H, I, J Model B: Elements B, C, D, G, H, I, J
Element A B C D E F G H I J
1.2.1 Complete the table below. (10)
Element Time (hour)
0.4
0.3
0.6
0.4
0.2
0.3
0.4
0.3
0.3
0.5
-3-
Element Element time Output expected (hours) Model A Model B
A 0.4 80 0 B 0.3 80 120 C 0.6 0 120 D 0.4 80 120 E 0.2 80 0 F 0.3 80 0 G 0.4 0 120 H 0.3 80 120
I 0.3 80 120 J 0.5 80 120
Total (requirements of A + B)
Total time/ week (hours)
Positional weight
1.2.2 Use the Ranked Positional Weight Method, and design an assembly line with minimum number of workstations and allocate work elements to the workstations. Cycle time is 120 hours per week. (Show the cumulative station time and unassigned station time). (10)
2.3 A repetitive manufacturing company producing components for the automotive industry would like to reduce their component lot sizes as part of their JIT
[TURN OVER]
-4-
implementation program. The following data is known about a component to be
moved to JIT transmission: Annual Demand:
Daily Production (12 hours): Desired Lot Size:
Holding Cost per unit per year:
Number of work days annually:
36 000 units 180 units
5 hours of production R88
300 days
2.3.1 Calculate the setup time (in seconds), based on a R50 per hour setup labour
cost. (5)
[19]
Step by Step Solution
There are 3 Steps involved in it
1 Expert Approved Answer
Step: 1 Unlock

Question Has Been Solved by an Expert!
Get step-by-step solutions from verified subject matter experts
Step: 2 Unlock
Step: 3 Unlock