

Question: Question 1- (14 points) (continued on the next page) At the beginning of 2015, you implement portfolio theory using your own inputs for expected returns,
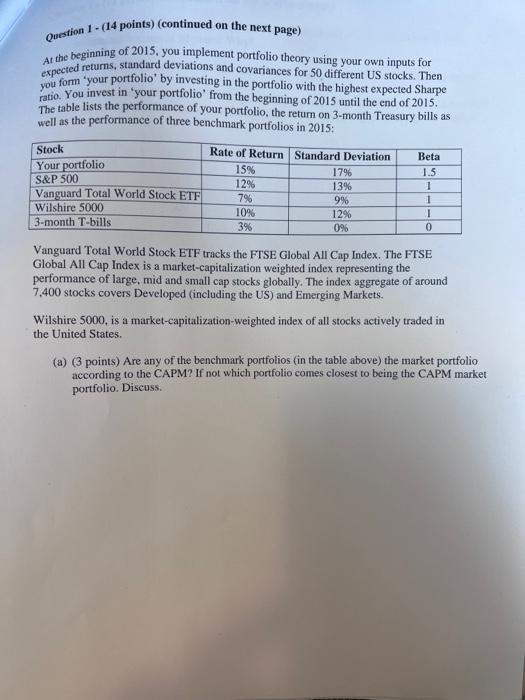
Question 1 - (14 points) (continued on the next page) At the beginning of 2015, you implement portfolio theory using your own inputs for expected returns, standard deviations and covariances for 50 different US stocks. Then you form 'your portfolio' by investing in the portfolio with the highest expected Sharpe ratio. You invest in 'your portfolio' from the beginning of 2015 until the end of 2015. The table lists the performance of your portfolio, the return on 3-month Treasury bills as well as the performance of three benchmark portfolios in 2015: Vanguard Total World Stock ETF tracks the FTSE Global All Cap Index. The FTSE Global All Cap Index is a market-capitalization weighted index representing the performance of large, mid and small cap stocks globally. The index aggregate of around 7,400 stocks covers Developed (including the US) and Emerging Markets. Wilshire 5000 , is a market-capitalization-weighted index of all stocks actively traded in the United States. (a) (3 points) Are any of the benchmark portfolios (in the table above) the market portfolio according to the CAPM? If not which portfolio comes closest to being the CAPM market portfolio. Discuss. aungents 1 . (14 points) (continued from the previous page) (b) ( 4 points) Given the investment choice above, which one would you choose if your investment horizon is 10 years? Why? (c) (4 points) Which portfolio had the best Sharpe measure in 2015 ? What does this mean? (d) (3 points) On December 31s",2015 your dad proclaims that "In 2016 you should invest in the portfolio that had the highest Sharpe measure in 2015." Agree or disagree? Explain
Step by Step Solution
There are 3 Steps involved in it

Get step-by-step solutions from verified subject matter experts