

Question: Question 1 (2 marks) The graphs below show the Minitab default, and an altered version of the graph; both graphs show the same data. Which
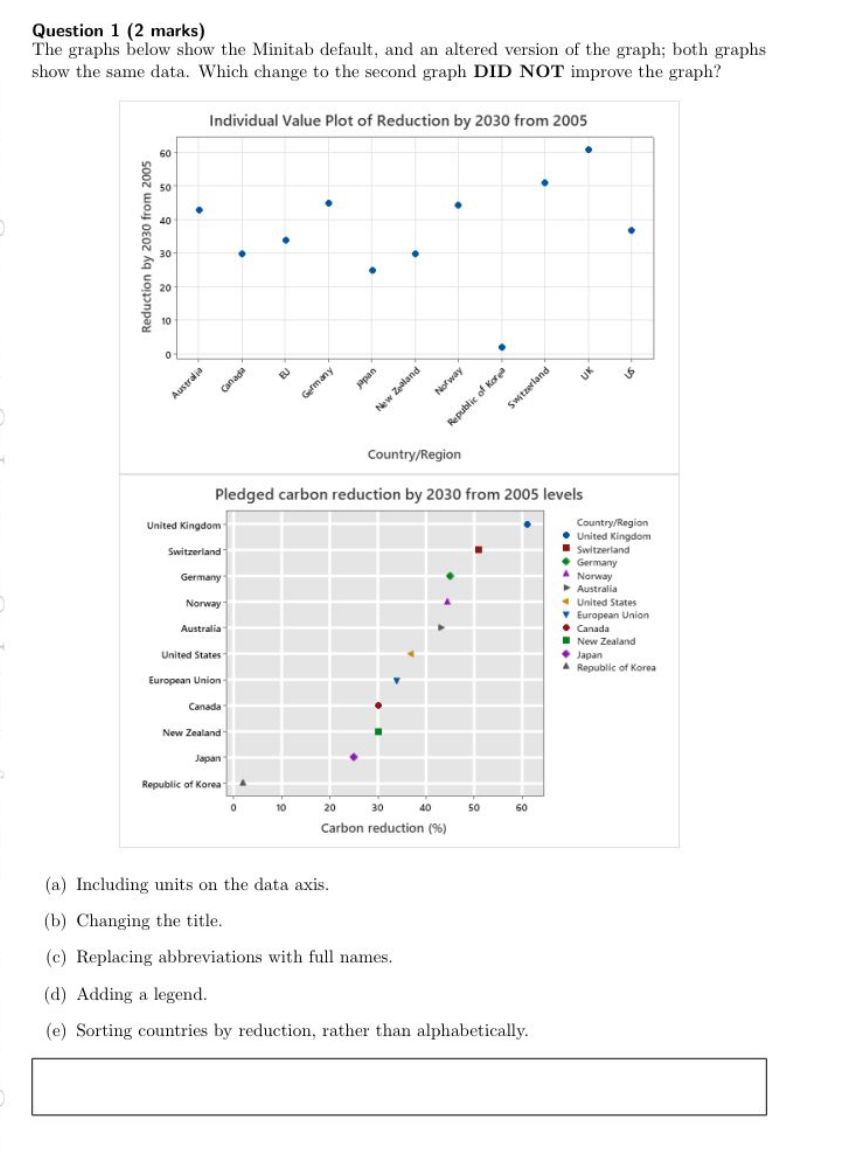
Question 1 (2 marks) The graphs below show the Minitab default, and an altered version of the graph; both graphs show the same data. Which change to the second graph DID NOT improve the graph? Individual Value Plot of Reduction by 2030 from 2005 60 50 Reduction by 2030 from 2005 8 o Australia canada Germany japan Norway New Zealand Switzerland Republic of Korea Country/Region Pledged carbon reduction by 2030 from 2005 levels United Kingdom Country/Region United Kingdom Switzerland Switzerland Germany Germany Norway Australia Norway United States European Union Australia Canada New Zealand United States Japan Republic of Korea European Union Canada New Zealand Japan Republic of Korea 20 30 40 50 60 Carbon reduction (9%) (a) Including units on the data axis. (b) Changing the title. (c) Replacing abbreviations with full names. (d) Adding a legend. (e) Sorting countries by reduction, rather than alphabetically
Step by Step Solution
There are 3 Steps involved in it

Get step-by-step solutions from verified subject matter experts