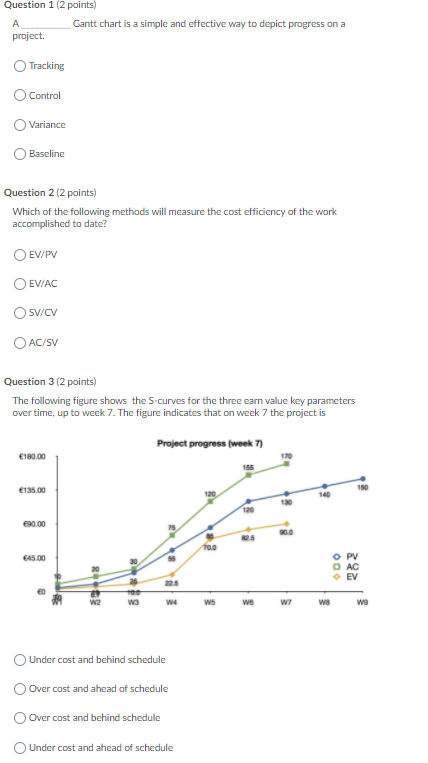
Question: Question 1 (2 points) A Gantt chart is a simple and effective way to depict progress on a project. Tracking Control Variance Baseline Question 2

Question 1 (2 points) A Gantt chart is a simpleQuestion 1 (2 points) A Gantt chart is a simple

Question 1 (2 points) A Gantt chart is a simple and effective way to depict progress on a project. Tracking Control Variance Baseline Question 2 (2 points) Which of the following methods will measure the cost efficiency of the work accomplished to date? EV/PV O EVAC SV/CV AC/SV Question 3 (2 points) The following figure shows the S-curves for the three earn value key parameters over time, up to week 7. The figure indicates that on week 7 the project is Project progress (week 7) 180.00 136 135.00 123 140 120 690.00 TOD 45.00 OPV EV 0 W2 WS W4 WS We WI wa W9 Under cost and behind schedule Over cost and ahead of schedule Over cost and behind schedule Under cost and ahead of schedule Question 4 (2 points) If a sample point plotted on a control chart is outside the control limits c the evidence indicates the process is in control the evidence is inconclusive None of these answer choices is correct the evidence indicates the process is out of control Question 5 (2 points) When a central chart is first developed, if the process is found to be out of control the control chart can be utilized the process should be examined and corrections made before a new control chart is constructed the control chart should not be utilized until more samples are taken the process should be replaced by a new process

Step by Step Solution

There are 3 Steps involved in it

1 Expert Approved Answer
Step: 1 Unlock blur-text-image
Question Has Been Solved by an Expert!

Get step-by-step solutions from verified subject matter experts

Step: 2 Unlock
Step: 3 Unlock

Students Have Also Explored These Related General Management Questions!