

Question: Question 1 (35 Marks) Read the case study below and answer the question(s) that follow. You are required to use Fixed Income Securities theory and
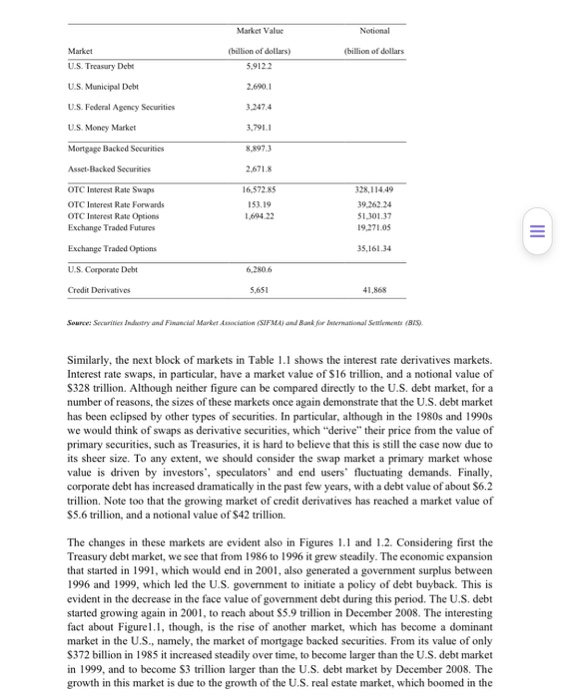
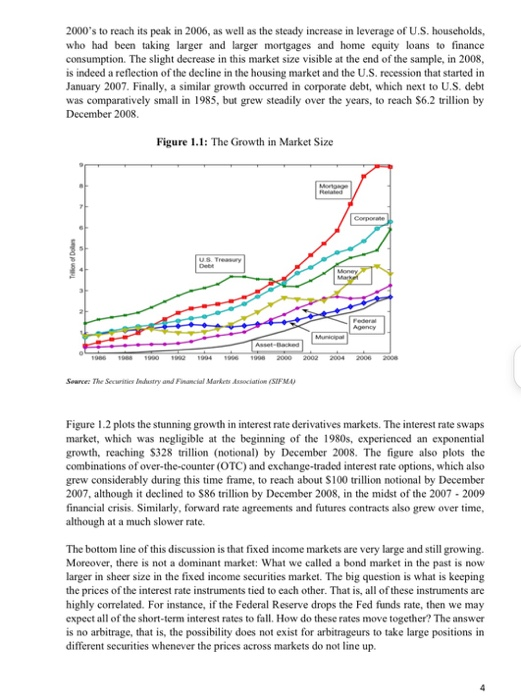
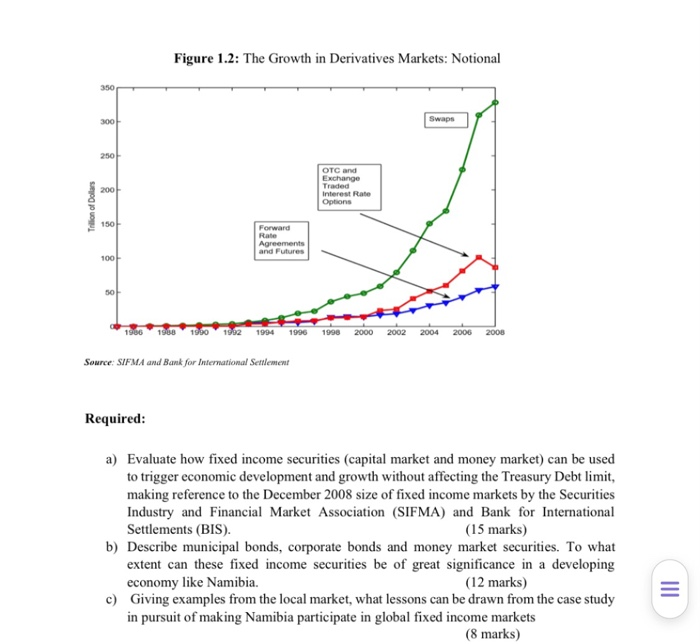
Question 1 (35 Marks) Read the case study below and answer the question(s) that follow. You are required to use Fixed Income Securities theory and related law sections in your answer(s) In the past two decades, fixed income markets have experienced an impressive growth, both in market value and in complexity. In the old days, until the end of the 1980s, fixed income markets were dominated by government debt securities, such as United States government Treasury bills, notes, and bonds. These securities were also relatively simple, as the U.S. government mainly issued bonds paying a fixed amount of money semi-annually. Although other governments, such as those of the United Kingdom and Italy, also experimented with other types of debt securities whose semi-annual payments were not fixed, but rather linked to a floating index, for instance, the inflation rate, such markets were relatively small. Thus, the U.S. government debt market was the main reference for global fixed income markets. Today, however, the U.S. government debt is no longer the dominant fixed income market, not so much because the U.S. debt shrank over the past two decades, but rather because other fixed income markets rose substantially relative to U.S. debt and became the main reference for fixed income pricing. Table 1.1 provides a snapshot of the sizes of fixed income markets as of December 2008. The first block of markets comprises the traditional fixed income markets, including U.S. government debt securities, municipal bonds, federal agency securities and the money market. The total size of these debt markets is around $15 trillion. The next block shows the size of the mortgage backed securities and asset-backed securities markets. In particular, the mortgage backed securities market stands as an $8.9 trillion market, a good $3 trillion larger than U.S. debt. Table 1.1: The Size of Fixed Income Markets: December 2008 Market Value Notional (billion of dollars (billion of dollars) 5.9122 2.690.1 Market U.S. Treasury Debt U.S. Municipal Debt U.S. Federal Agency Securities U.S. Money Market Mortgage Backod Securities Asset-Backed Securities 3.247.4 3.791.1 8.897.3 2.6718 16,5725 153.19 328,114.49 39,262,24 51,301,37 19.271.05 III OTC Interest Rate Swaps OTC Interest Rate Forwards OTC Interest Rate Options Exchange Traded Futuros Exchange Traded Options U.S. Corporate Debt Credit Derivatives 35.161.34 6.2806 5,651 41,868 Source: Securities Industry and Financial Market Association (SFM) and Bank for International Semiments (BIS) Similarly, the next block of markets in Table 1.1 shows the interest rate derivatives markets. Interest rate swaps, in particular, have a market value of S16 trillion, and a notional value of S328 trillion. Although neither figure can be compared directly to the U.S. debt market, for a number of reasons, the sizes of these markets once again demonstrate that the U.S. debt market has been eclipsed by other types of securities. In particular, although in the 1980s and 1990s we would think of swaps as derivative securities, which "derive" their price from the value of primary securities, such as Treasuries, it is hard to believe that this is still the case now due to its sheer size. To any extent, we should consider the swap market a primary market whose value is driven by investors", speculators' and end users' fluctuating demands. Finally, corporate debt has increased dramatically in the past few years, with a debt value of about $6.2 trillion. Note too that the growing market of credit derivatives has reached a market value of $5.6 trillion, and a notional value of $42 trillion. The changes in these markets are evident also in Figures 1.1 and 1.2. Considering first the Treasury debt market, we see that from 1986 to 1996 it grew steadily. The economic expansion that started in 1991, which would end in 2001, also generated a government surplus between 1996 and 1999, which led the U.S. government to initiate a policy of debt buyback. This is evident in the decrease in the face value of government debt during this period. The U.S. debt started growing again in 2001, to reach about $5.9 trillion in December 2008. The interesting fact about Figurel.1, though, is the rise of another market, which has become a dominant market in the U.S., namely, the market of mortgage backed securities. From its value of only $372 billion in 1985 it increased steadily over time, to become larger than the U.S. debt market in 1999, and to become $3 trillion larger than the U.S. debt market by December 2008. The growth in this market is due to the growth of the U.S. real estate market, which boomed in the 2000's to reach its peak in 2006, as well as the steady increase in leverage of U.S. households, who had been taking larger and larger mortgages and home equity loans to finance consumption. The slight decrease in this market size visible at the end of the sample, in 2008, is indeed a reflection of the decline in the housing market and the U.S. recession that started in January 2007. Finally, a similar growth occurred in corporate debt, which next to U.S. debt was comparatively small in 1985, but grew steadily over the years, to reach $6.2 trillion by December 2008 Figure 1.1: The Growth in Market Size Moog Corporate info US. Try Det Money Mark Pedir Agency Muri 1908 1909 1902 1904 1906 2000 2002 2004 2005 2006 Seance: The Securities Industry and Financial Markets Association (SIFMU) Figure 1.2 plots the stunning growth in interest rate derivatives markets. The interest rate swaps market, which was negligible at the beginning of the 1980s, experienced an exponential growth, reaching $328 trillion (notional) by December 2008. The figure also plots the combinations of over-the-counter (OTC) and exchange-traded interest rate options, which also grew considerably during this time frame, to reach about $100 trillion notional by December 2007, although it declined to 586 trillion by December 2008, in the midst of the 2007 - 2009 financial crisis. Similarly, forward rate agreements and futures contracts also grew over time, although at a much slower rate. The bottom line of this discussion is that fixed income markets are very large and still growing. Moreover, there is not a dominant market: What we called a bond market in the past is now larger in sheer size in the fixed income securities market. The big question is what is keeping the prices of the interest rate instruments tied to each other. That is, all of these instruments are highly correlated. For instance, if the Federal Reserve drops the Fed funds rate, then we may expect all of the short-term interest rates to fall. How do these rates move together? The answer is no arbitrage, that is, the possibility does not exist for arbitrageurs to take large positions in different securities whenever the prices across markets do not line up. 4 Figure 1.2: The Growth in Derivatives Markets: Notional 300 Swaps 250 200 Trillion of Dollars OTC and Exchange Traded Interest Rate Options 150 Forward Rate Agreements and Futures 100 50 1966 1968 1990 1992 1994 1996 1998 2000 2002 2004 2006 2008 Source: SIFMA and Bank for International Settlement Required: a) Evaluate how fixed income securities (capital market and money market) can be used to trigger economic development and growth without affecting the Treasury Debt limit, making reference to the December 2008 size of fixed income markets by the Securities Industry and Financial Market Association (SIFMA) and Bank for International Settlements (BIS). (15 marks) b) Describe municipal bonds, corporate bonds and money market securities. To what extent can these fixed income securities be of great significance in a developing economy like Namibia (12 marks) c) Giving examples from the local market, what lessons can be drawn from the case study in pursuit of making Namibia participate in global fixed income markets (8 marks) = Question 1 (35 Marks) Read the case study below and answer the question(s) that follow. You are required to use Fixed Income Securities theory and related law sections in your answer(s) In the past two decades, fixed income markets have experienced an impressive growth, both in market value and in complexity. In the old days, until the end of the 1980s, fixed income markets were dominated by government debt securities, such as United States government Treasury bills, notes, and bonds. These securities were also relatively simple, as the U.S. government mainly issued bonds paying a fixed amount of money semi-annually. Although other governments, such as those of the United Kingdom and Italy, also experimented with other types of debt securities whose semi-annual payments were not fixed, but rather linked to a floating index, for instance, the inflation rate, such markets were relatively small. Thus, the U.S. government debt market was the main reference for global fixed income markets. Today, however, the U.S. government debt is no longer the dominant fixed income market, not so much because the U.S. debt shrank over the past two decades, but rather because other fixed income markets rose substantially relative to U.S. debt and became the main reference for fixed income pricing. Table 1.1 provides a snapshot of the sizes of fixed income markets as of December 2008. The first block of markets comprises the traditional fixed income markets, including U.S. government debt securities, municipal bonds, federal agency securities and the money market. The total size of these debt markets is around $15 trillion. The next block shows the size of the mortgage backed securities and asset-backed securities markets. In particular, the mortgage backed securities market stands as an $8.9 trillion market, a good $3 trillion larger than U.S. debt. Table 1.1: The Size of Fixed Income Markets: December 2008 Market Value Notional (billion of dollars (billion of dollars) 5.9122 2.690.1 Market U.S. Treasury Debt U.S. Municipal Debt U.S. Federal Agency Securities U.S. Money Market Mortgage Backod Securities Asset-Backed Securities 3.247.4 3.791.1 8.897.3 2.6718 16,5725 153.19 328,114.49 39,262,24 51,301,37 19.271.05 III OTC Interest Rate Swaps OTC Interest Rate Forwards OTC Interest Rate Options Exchange Traded Futuros Exchange Traded Options U.S. Corporate Debt Credit Derivatives 35.161.34 6.2806 5,651 41,868 Source: Securities Industry and Financial Market Association (SFM) and Bank for International Semiments (BIS) Similarly, the next block of markets in Table 1.1 shows the interest rate derivatives markets. Interest rate swaps, in particular, have a market value of S16 trillion, and a notional value of S328 trillion. Although neither figure can be compared directly to the U.S. debt market, for a number of reasons, the sizes of these markets once again demonstrate that the U.S. debt market has been eclipsed by other types of securities. In particular, although in the 1980s and 1990s we would think of swaps as derivative securities, which "derive" their price from the value of primary securities, such as Treasuries, it is hard to believe that this is still the case now due to its sheer size. To any extent, we should consider the swap market a primary market whose value is driven by investors", speculators' and end users' fluctuating demands. Finally, corporate debt has increased dramatically in the past few years, with a debt value of about $6.2 trillion. Note too that the growing market of credit derivatives has reached a market value of $5.6 trillion, and a notional value of $42 trillion. The changes in these markets are evident also in Figures 1.1 and 1.2. Considering first the Treasury debt market, we see that from 1986 to 1996 it grew steadily. The economic expansion that started in 1991, which would end in 2001, also generated a government surplus between 1996 and 1999, which led the U.S. government to initiate a policy of debt buyback. This is evident in the decrease in the face value of government debt during this period. The U.S. debt started growing again in 2001, to reach about $5.9 trillion in December 2008. The interesting fact about Figurel.1, though, is the rise of another market, which has become a dominant market in the U.S., namely, the market of mortgage backed securities. From its value of only $372 billion in 1985 it increased steadily over time, to become larger than the U.S. debt market in 1999, and to become $3 trillion larger than the U.S. debt market by December 2008. The growth in this market is due to the growth of the U.S. real estate market, which boomed in the 2000's to reach its peak in 2006, as well as the steady increase in leverage of U.S. households, who had been taking larger and larger mortgages and home equity loans to finance consumption. The slight decrease in this market size visible at the end of the sample, in 2008, is indeed a reflection of the decline in the housing market and the U.S. recession that started in January 2007. Finally, a similar growth occurred in corporate debt, which next to U.S. debt was comparatively small in 1985, but grew steadily over the years, to reach $6.2 trillion by December 2008 Figure 1.1: The Growth in Market Size Moog Corporate info US. Try Det Money Mark Pedir Agency Muri 1908 1909 1902 1904 1906 2000 2002 2004 2005 2006 Seance: The Securities Industry and Financial Markets Association (SIFMU) Figure 1.2 plots the stunning growth in interest rate derivatives markets. The interest rate swaps market, which was negligible at the beginning of the 1980s, experienced an exponential growth, reaching $328 trillion (notional) by December 2008. The figure also plots the combinations of over-the-counter (OTC) and exchange-traded interest rate options, which also grew considerably during this time frame, to reach about $100 trillion notional by December 2007, although it declined to 586 trillion by December 2008, in the midst of the 2007 - 2009 financial crisis. Similarly, forward rate agreements and futures contracts also grew over time, although at a much slower rate. The bottom line of this discussion is that fixed income markets are very large and still growing. Moreover, there is not a dominant market: What we called a bond market in the past is now larger in sheer size in the fixed income securities market. The big question is what is keeping the prices of the interest rate instruments tied to each other. That is, all of these instruments are highly correlated. For instance, if the Federal Reserve drops the Fed funds rate, then we may expect all of the short-term interest rates to fall. How do these rates move together? The answer is no arbitrage, that is, the possibility does not exist for arbitrageurs to take large positions in different securities whenever the prices across markets do not line up. 4 Figure 1.2: The Growth in Derivatives Markets: Notional 300 Swaps 250 200 Trillion of Dollars OTC and Exchange Traded Interest Rate Options 150 Forward Rate Agreements and Futures 100 50 1966 1968 1990 1992 1994 1996 1998 2000 2002 2004 2006 2008 Source: SIFMA and Bank for International Settlement Required: a) Evaluate how fixed income securities (capital market and money market) can be used to trigger economic development and growth without affecting the Treasury Debt limit, making reference to the December 2008 size of fixed income markets by the Securities Industry and Financial Market Association (SIFMA) and Bank for International Settlements (BIS). (15 marks) b) Describe municipal bonds, corporate bonds and money market securities. To what extent can these fixed income securities be of great significance in a developing economy like Namibia (12 marks) c) Giving examples from the local market, what lessons can be drawn from the case study in pursuit of making Namibia participate in global fixed income markets (8 marks) =
Step by Step Solution
There are 3 Steps involved in it

Get step-by-step solutions from verified subject matter experts