

Question: Question 1 (4 points) From the Behavioral Risk Factor Surveillance System in 2019, the prevalence of self- reported obesity among Michigan adult residents was 35.0%.

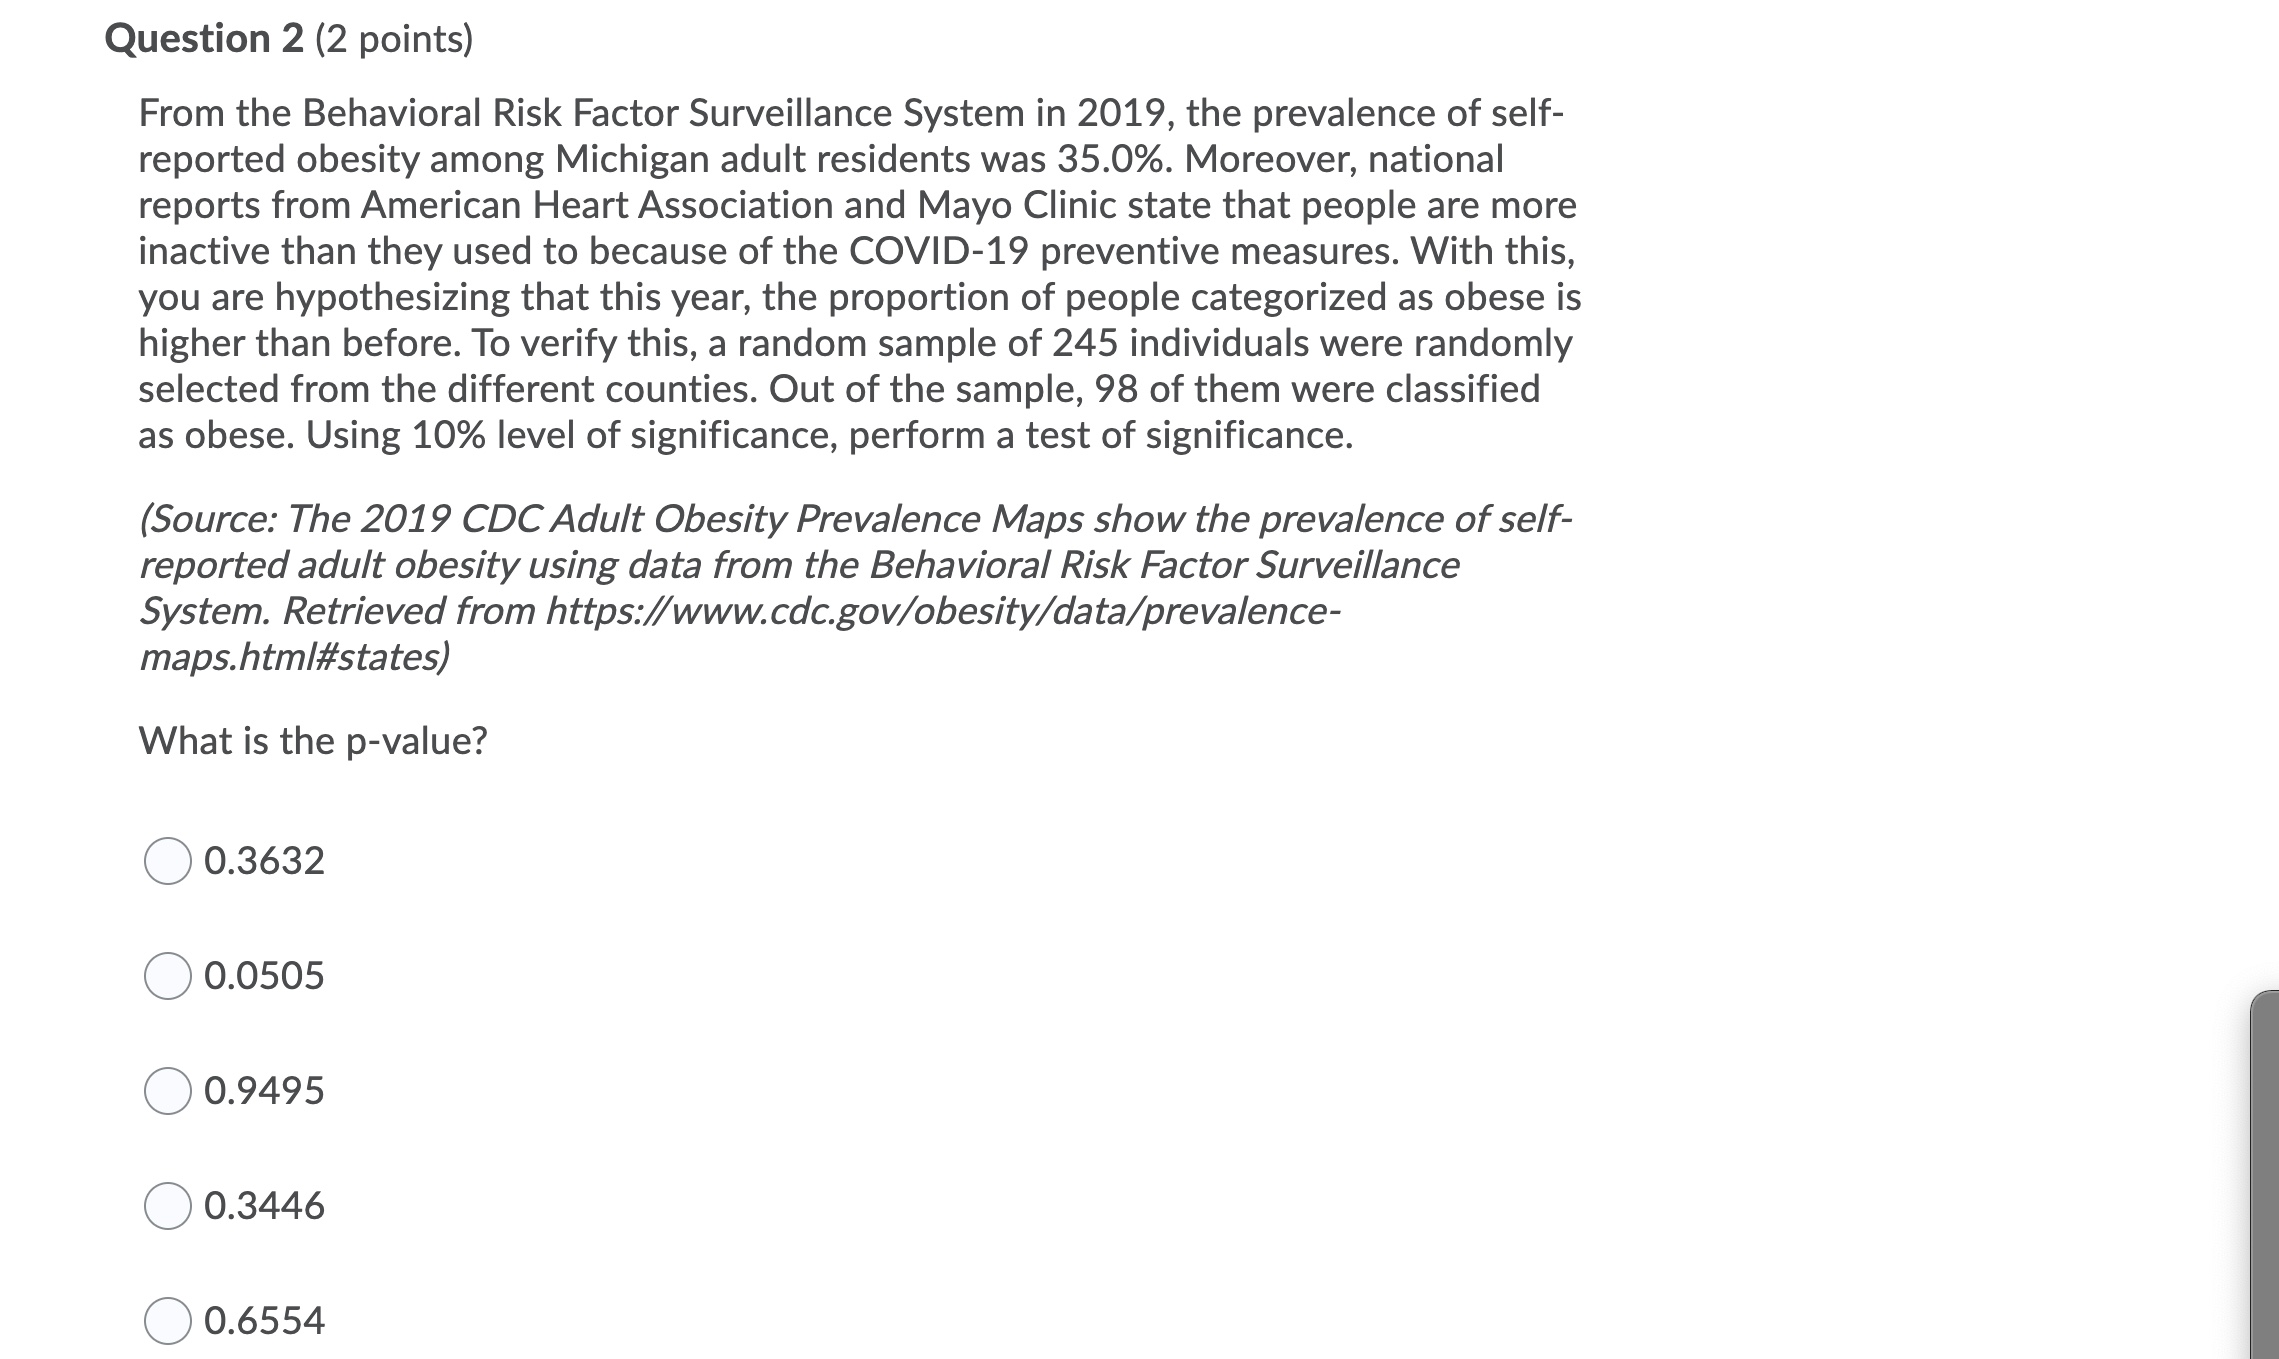
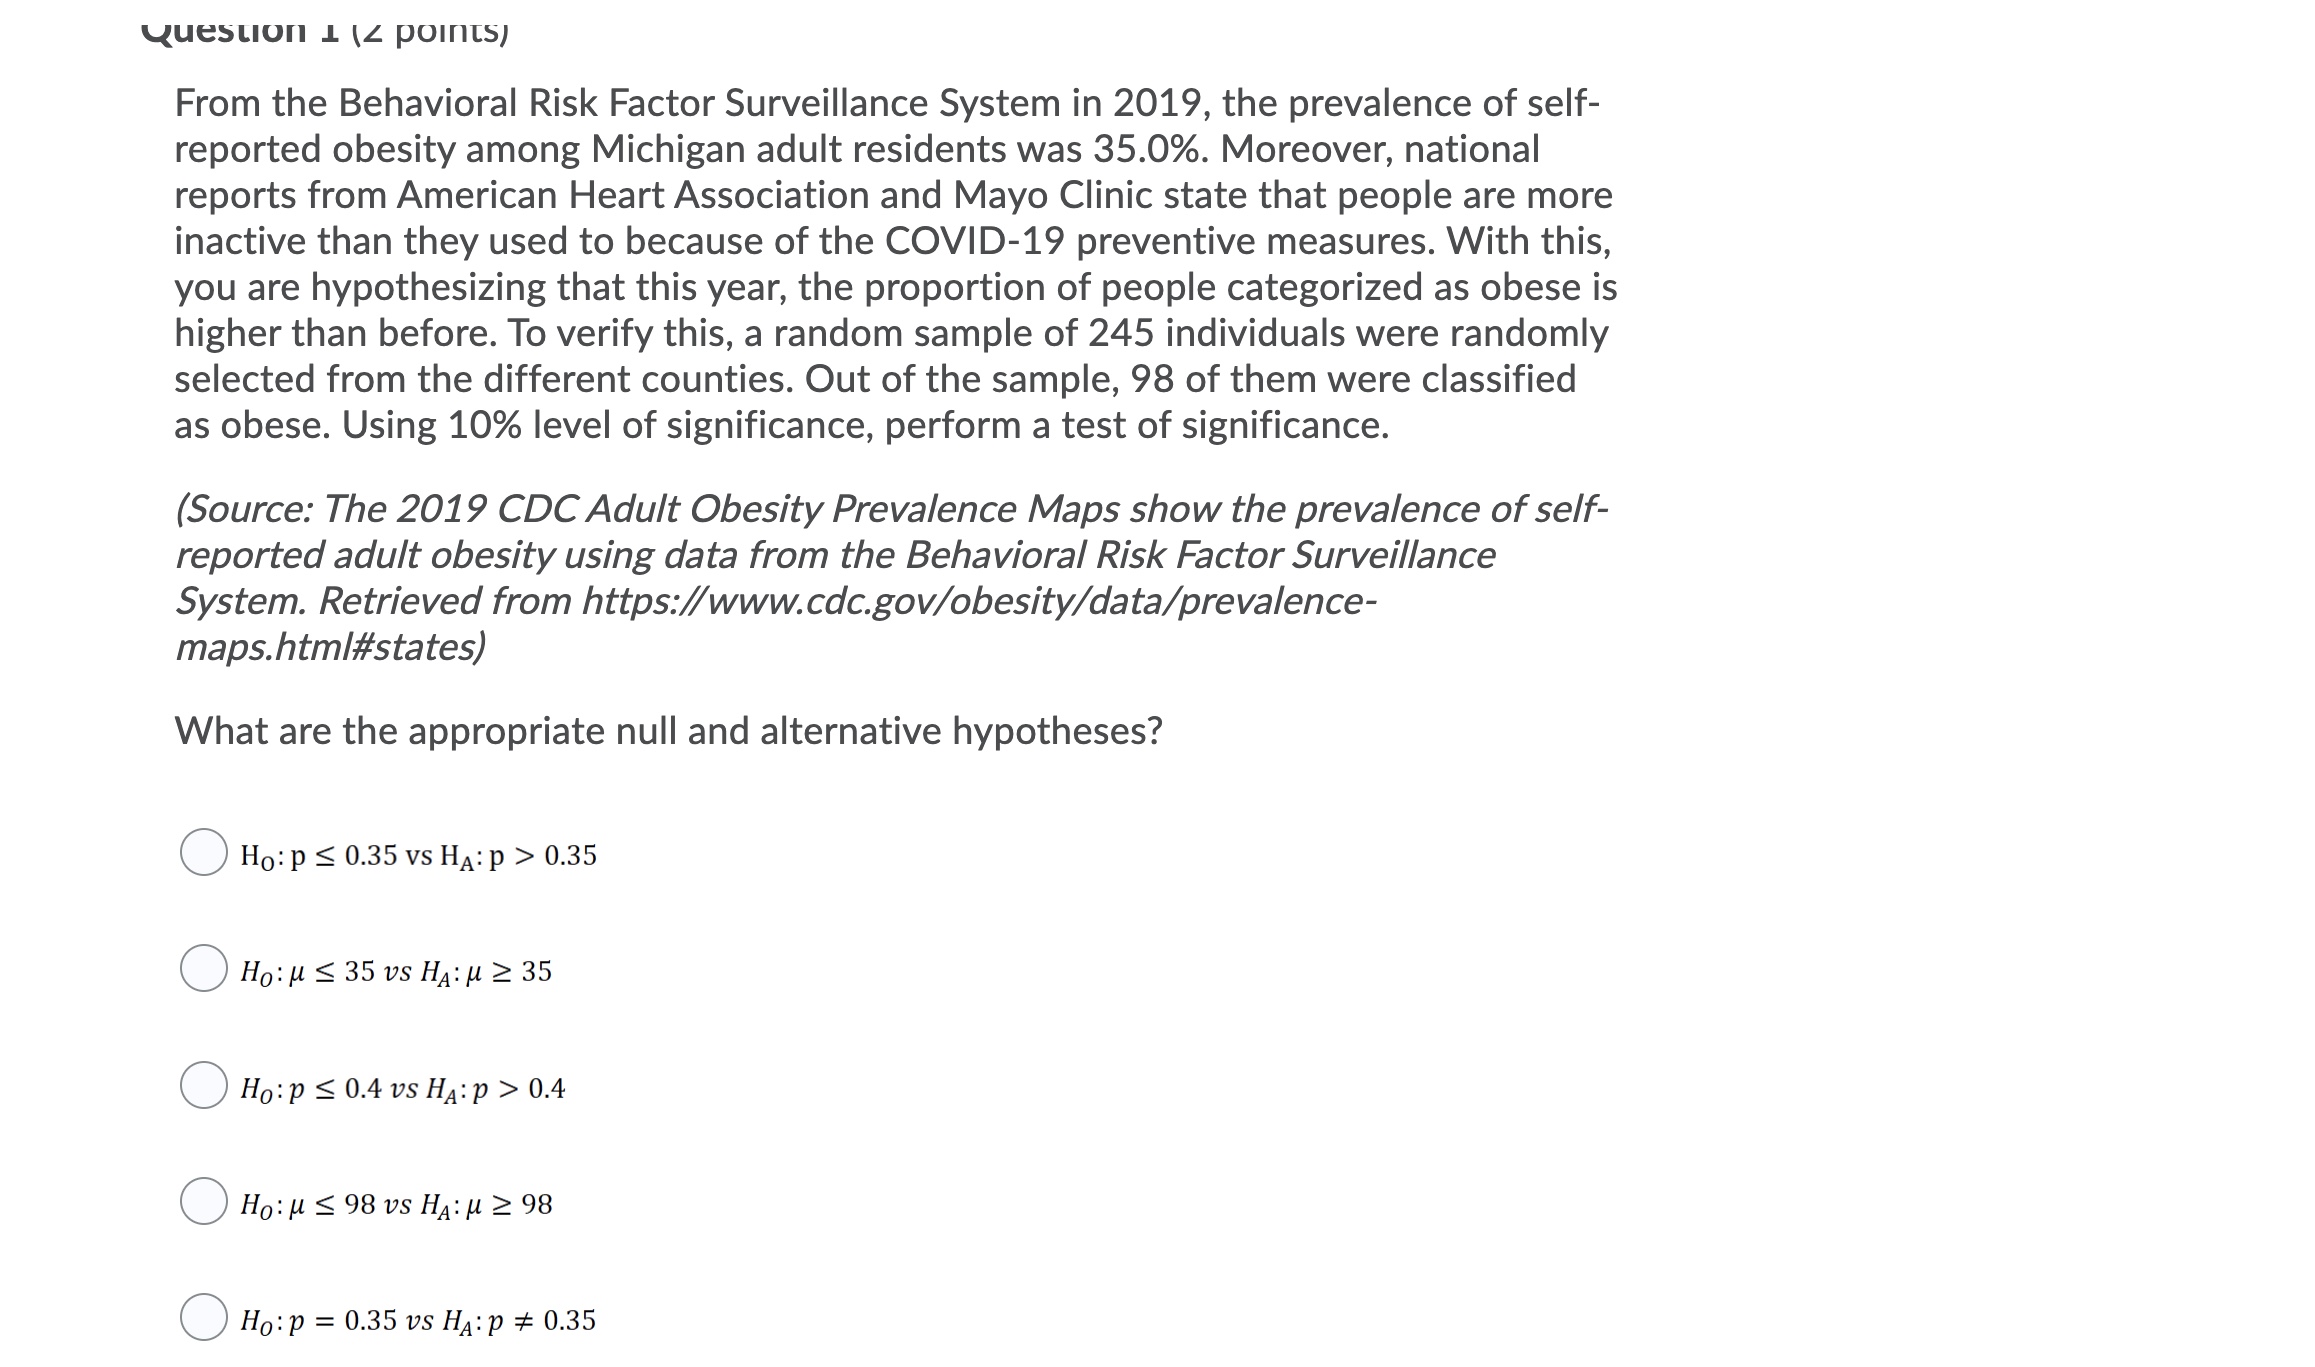

Question 1 (4 points) From the Behavioral Risk Factor Surveillance System in 2019, the prevalence of self- reported obesity among Michigan adult residents was 35.0%. Moreover, national reports from American Heart Association and Mayo Clinic state that people are more inactive than they used to because of the COVID-19 preventive measures. With this, you are hypothesizing that this year, the proportion of people categorized as obese is higher than before. To verify this, a random sample of 245 individuals were randomly selected from the different counties. Out of the sample, 98 of them were classified as obese. Using 10% level of significance, perform a test of significance. (Source: The 2019 CDC Adult Obesity Prevalence Maps show the prevalence of self- reported adult obesity using data from the Behavioral Risk Factor Surveillance System. Retrieved from https://www.cdc.gov/obesity/data/prevalence- maps.html#states) What are the appropriate null and alternative hypotheses? OHo:p s 0.35 vs HA: P > 0.35 OHO: M S 35 US HA: M 2 35 OHo: P S 0.4 US HA: P > 0.4 OHO:M S 98 VS HA: M 2 98 Ho:p = 0.35 Us HA: p # 0.35Question 2 (2 points) From the Behavioral Risk Factor Surveillance System in 2019, the prevalence of self- reported obesity among Michigan adult residents was 35.0%. Moreover, national reports from American Heart Association and Mayo Clinic state that people are more inactive than they used to because of the COVID-19 preventive measures. With this, you are hypothesizing that this year, the proportion of people categorized as obese is higher than before. To verify this, a random sample of 245 individuals were randomly selected from the different counties. Out of the sample, 98 of them were classified as obese. Using 10% level of significance, perform a test of significance. (Source: The 2019 CDC Adult Obesity Prevalence Maps show the prevalence of self- reported adult obesity using data from the Behavioral Risk Factor Surveillance System. Retrieved from https://www. cdc.gov/obesity/data/prevalence- maps.html#sta tes) What is the p-value? 0 0.3632 0 0.0505 0 0.9495 0 0.3446 Q 0.6554
Step by Step Solution
There are 3 Steps involved in it

Get step-by-step solutions from verified subject matter experts