

Question: Question 1: 4 Year Demand 1 7 2 9 3 5 5 13 6 8 7 12 8 13 9 9 10 11 11 7
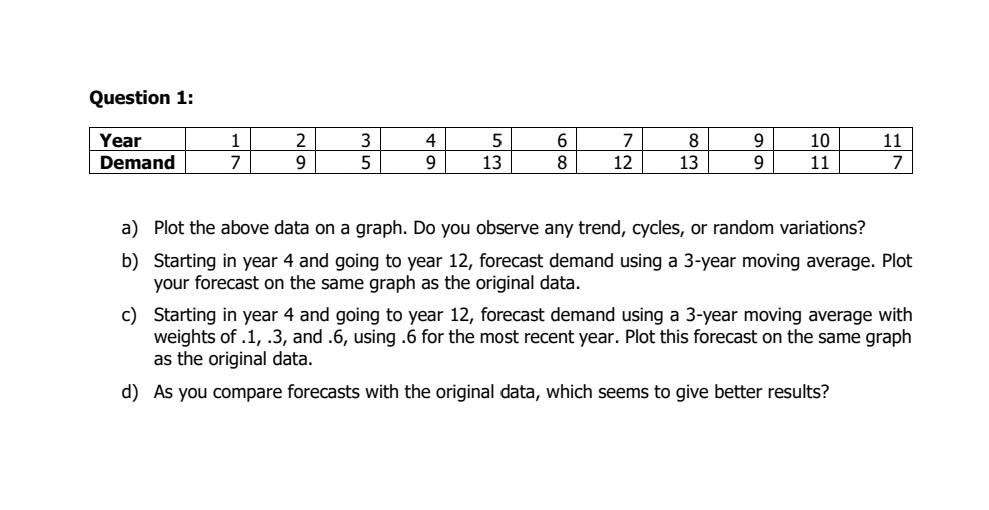
Question 1: 4 Year Demand 1 7 2 9 3 5 5 13 6 8 7 12 8 13 9 9 10 11 11 7 9 a) Plot the above data on a graph. Do you observe any trend, cycles, or random variations? b) Starting in year 4 and going to year 12, forecast demand using a 3-year moving average. Plot your forecast on the same graph as the original data. c) Starting in year 4 and going to year 12, forecast demand using a 3-year moving average with weights of .1,.3, and .6, using .6 for the most recent year. Plot this forecast on the same graph as the original data. d) As you compare forecasts with the original data, which seems to give better results
Step by Step Solution
There are 3 Steps involved in it
1 Expert Approved Answer
Step: 1 Unlock

Question Has Been Solved by an Expert!
Get step-by-step solutions from verified subject matter experts
Step: 2 Unlock
Step: 3 Unlock