

Question: Question 1 (5 points) The table below indicates the consumption of sandwich supplies for a typical family in San Diego each year. The number of
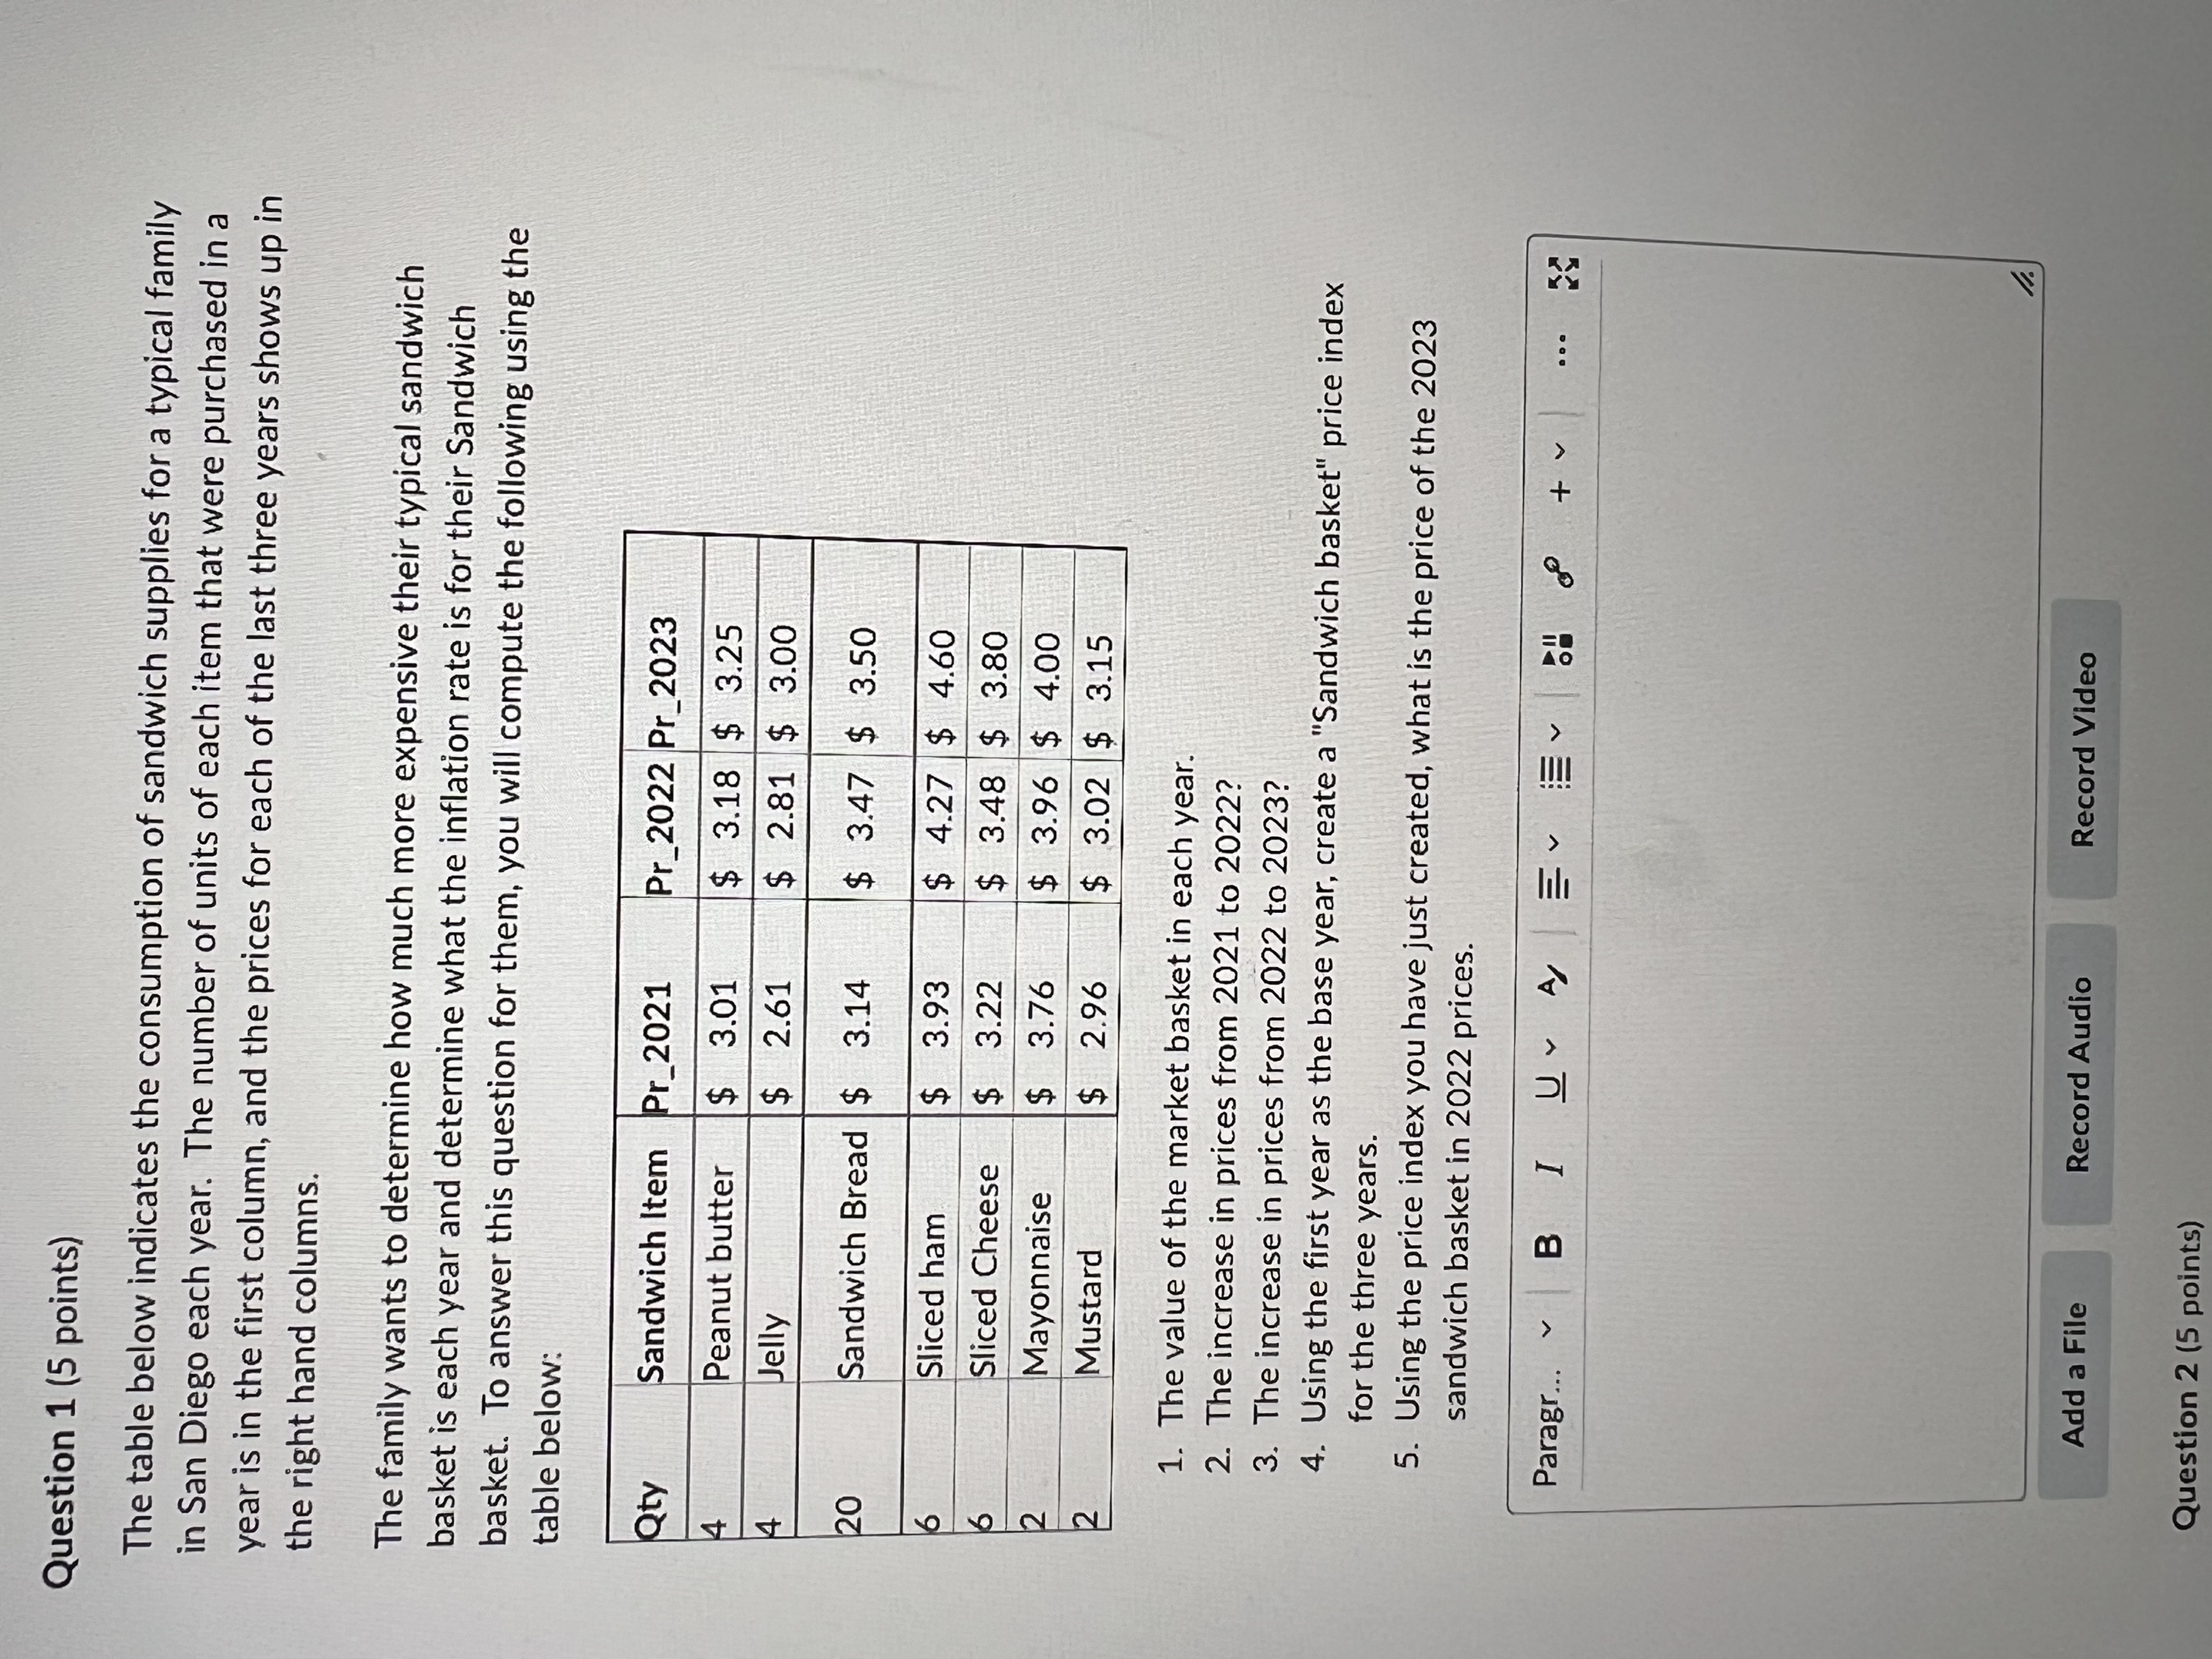

Question 1 (5 points) The table below indicates the consumption of sandwich supplies for a typical family in San Diego each year. The number of units of each item that were purchased in a year is in the first column, and the prices for each of the last three years shows up in the right hand columns. The family wants to determine how much more expensive their typical sandwich basket is each year and determine what the inflation rate is for their Sandwich basket. To answer this question for them, you will compute the following using the table below: Qty Sandwich Item Pr_2021 Pr_2022 Pr_2023 4 Peanut butter $ 3.01 $ 3.18 $ 3.25 4 Jelly $ 2.61 $ 2.81 $ 3.00 20 Sandwich Bread $ 3.14 $ 3.47 $ 3.50 6 Sliced ham $ 3.93 $ 4.27 $ 4.60 6 Sliced Cheese $ 3.22 $ 3.48 $ 3.80 Mayonnaise $ 3.76 $ 3.96 $ 4.00 NN Mustard $ 2.96 $ 3.02 $ 3.15 1. The value of the market basket in each year. 2. The increase in prices from 2021 to 2022? 3. The increase in prices from 2022 to 2023? 4. Using the first year as the base year, create a "Sandwich basket" price index for the three years. 5. Using the price index you have just created, what is the price of the 2023 sandwich basket in 2022 prices. Paragr... BIU A EVE + . . . Add a File Record Audio Record Video Question 2 (5 points)
Step by Step Solution
There are 3 Steps involved in it

Get step-by-step solutions from verified subject matter experts