

Question: QUESTION 1 6 CHAPTER 3 ( Part 2 ) The manager of Champion Cooling Company has recently implemented a statistical process control method. The accompanying
QUESTION
CHAPTER
Part
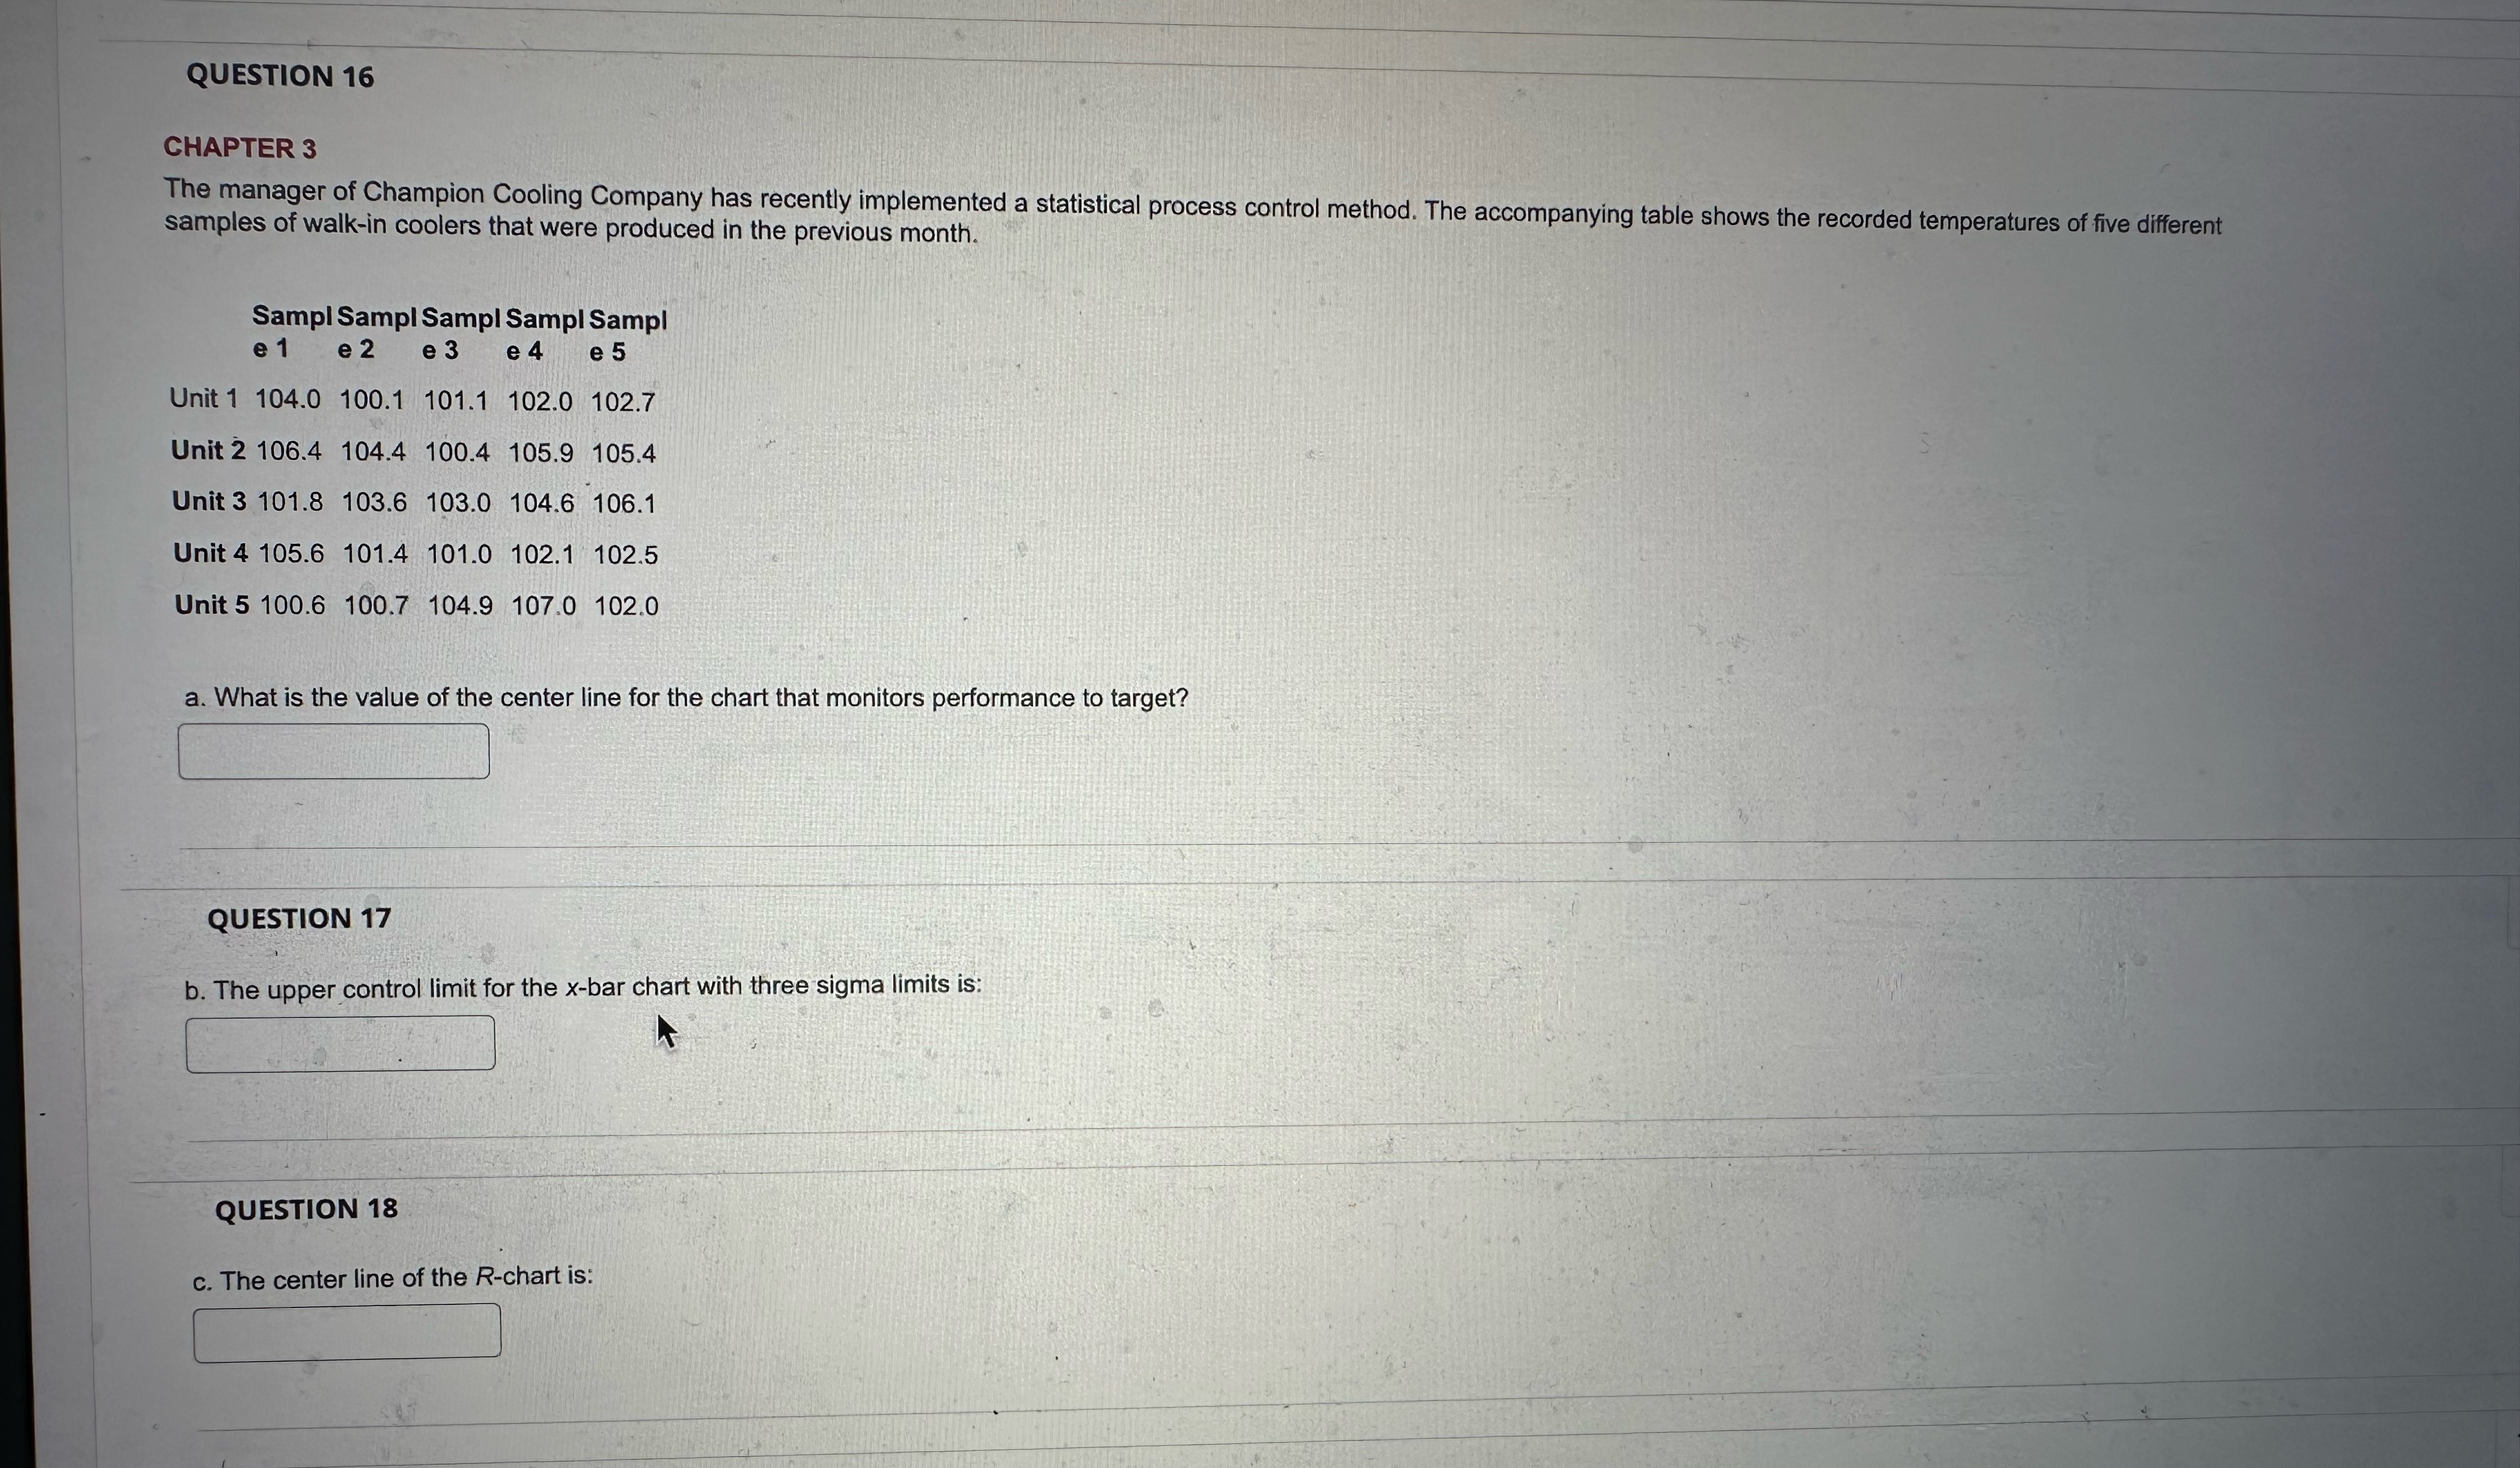
The manager of Champion Cooling Company has recently implemented a statistical process control method. The accompanying table shows the recorded temperatures of five different samples of walkin coolers that were produced in the previous month.
Sampl Sampl Sampl Sampl Sampl
e e e e e
Unit
Unit
Unit
Unit
Unit
a What is the value of the center line for the chart that monitors performance to target?
QUESTION
b The upper control limit for the bar chart with three sigma limits is:
QUESTION
c The center line of the chart is:
Step by Step Solution
There are 3 Steps involved in it
1 Expert Approved Answer
Step: 1 Unlock

Question Has Been Solved by an Expert!
Get step-by-step solutions from verified subject matter experts
Step: 2 Unlock
Step: 3 Unlock