

Question: Question 1: (6+2 = 8 Maks) a- Construct a Frequency Distribution of the following date set with 5 classes 1 3 4 6 7
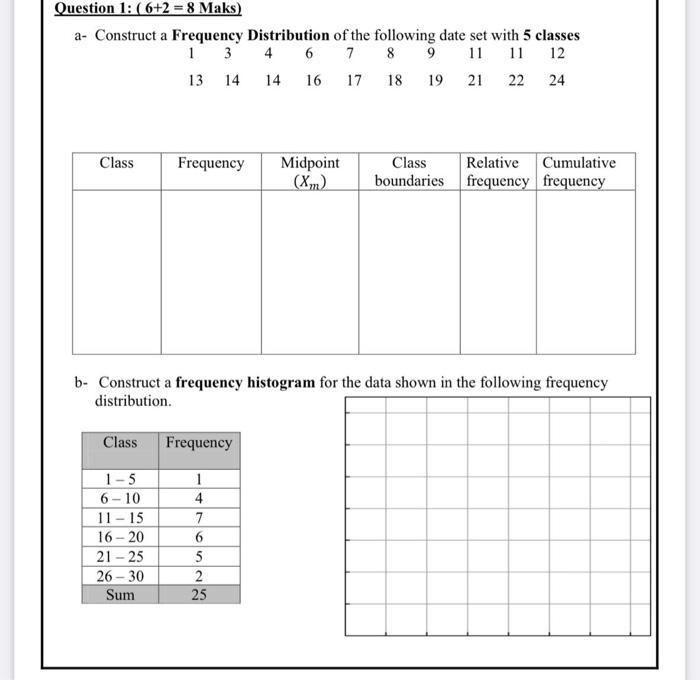
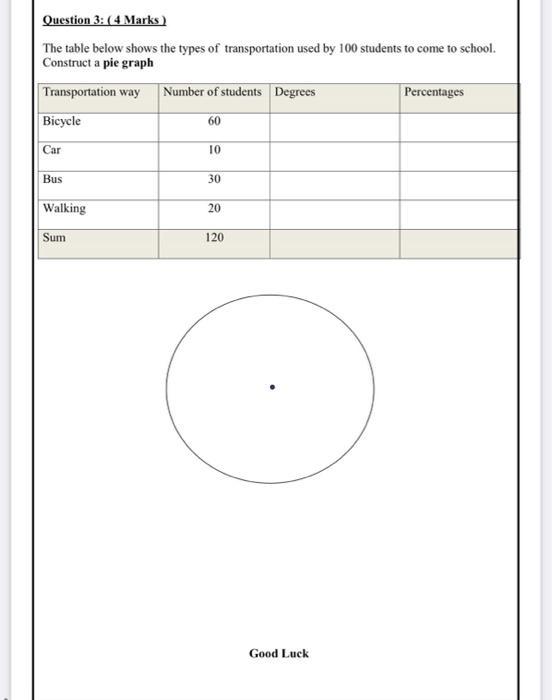
Question 1: (6+2 = 8 Maks) a- Construct a Frequency Distribution of the following date set with 5 classes 1 3 4 6 7 8 9 11 11 12 13 14 16 17 18 19 21 22 24 Class Frequency 1-5 6-10 11-15 16-20 21-25 26-30 Sum 14 Class Frequency 1 4 b- Construct a frequency histogram for the data shown in the following frequency distribution. 7 6 5 2 25 Midpoint (Xm) Class boundaries Relative Cumulative frequency frequency Question 3: (4 Marks) The table below shows the types of transportation used by 100 students to come to school. Construct a pie graph Transportation way Number of students Degrees Bicycle 60 Car Bus Walking Sum 10 30 20 120 Good Luck Percentages
Step by Step Solution
3.47 Rating (157 Votes )
There are 3 Steps involved in it
Question 1 classes frequency Midpoint Class boundaries Relative frequency C... View full answer

Get step-by-step solutions from verified subject matter experts