

Question: The data in Table 16 represent the temperature of a pizza removed from an oven measured in 5-minute intervals. (a) Draw a scatter diagram of
The data in Table 16 represent the temperature of a pizza removed from an oven measured in 5-minute intervals.
(a) Draw a scatter diagram of the data treating time, x, as the explanatory variable.
Comment on the shape of the scatter diagram.
(b) Determine Y = log y. Draw a scatter diagram treating the year, x, as the explanatory variable and Y = log y as the response variable. Comment on the shape of the scatter diagram.
(c) Find the least-squares regression line of the transformed data.
(d) Determine the exponential equation of best fit and graph it on the scatter diagram obtained in part (a).
(e) Use the exponential equation to determine the temperature of the pizza when it was removed from the oven.
(f) Use the exponential equation to predict the temperature of the pizza after 40 minutes.
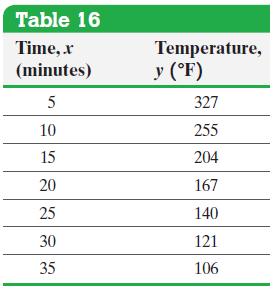
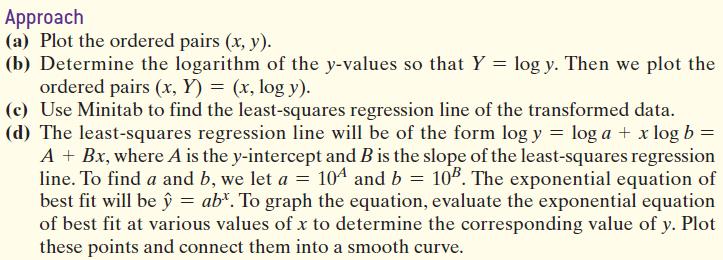
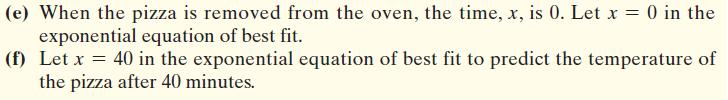
Table 16 Time,.r (minutes) Temperature, y (F) 5 327 10 255 15 204 20 167 25 140 30 121 35 106
Step by Step Solution
There are 3 Steps involved in it
a Figure 32 shows a scatter diagram of the data pre... View full answer

Get step-by-step solutions from verified subject matter experts