

Question: Question 1 7 ( 1 point ) Exhibit 1 5 - 5 Below is a partial Excel output based on a sample of 2 5
Question point
Exhibit
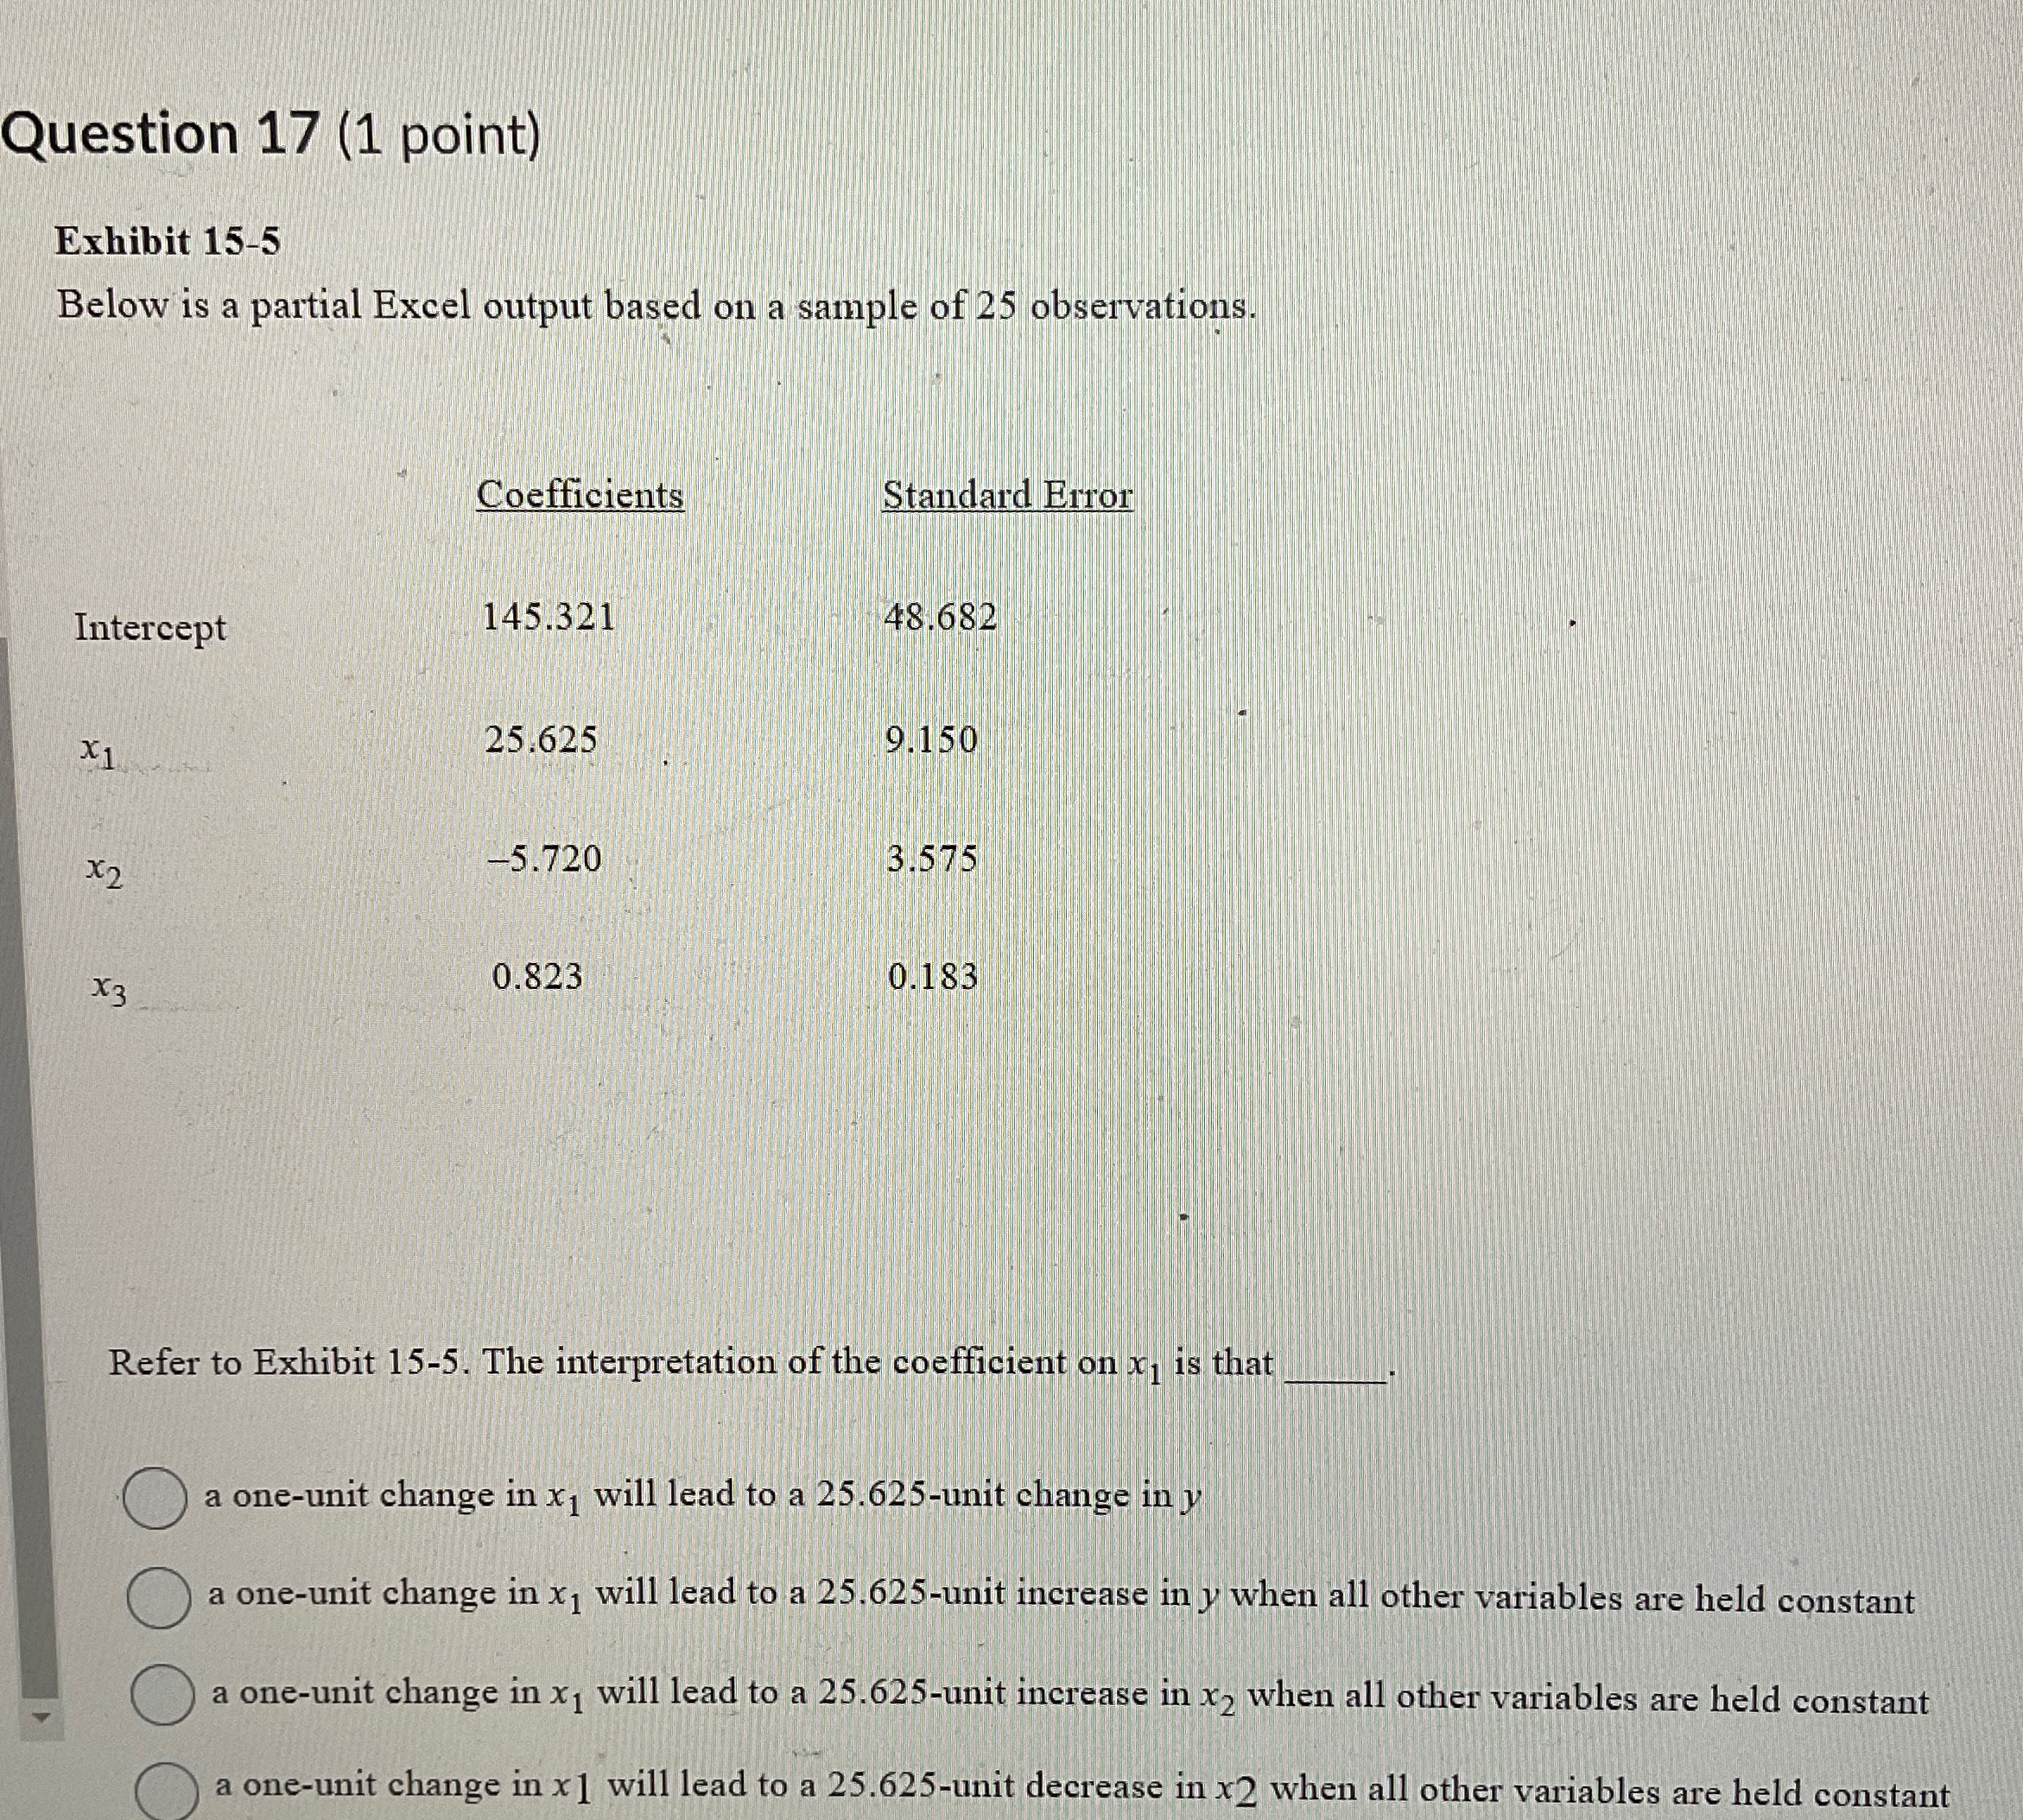
Below is a partial Excel output based on a sample of observations.
tableCoefficients,StandardIntercept
Refer to Exhibit The interpretation of the coefficient on is that
a oneunit change in will lead to a unit change in
a oneunit change in will lead to a unit increase in when all other variables are held constant
a oneunit change in will lead to a unit increase in when all other variables are held constant
a oneunit change in will lead to a unit decrease in when all other variables are held constant
Step by Step Solution
There are 3 Steps involved in it
1 Expert Approved Answer
Step: 1 Unlock

Question Has Been Solved by an Expert!
Get step-by-step solutions from verified subject matter experts
Step: 2 Unlock
Step: 3 Unlock