Question: QUESTION 1: [7 POINTS) Use the file Intro to Pivot Tables Part 1.xlsx and do the following: 1. Create a pivot table for the following
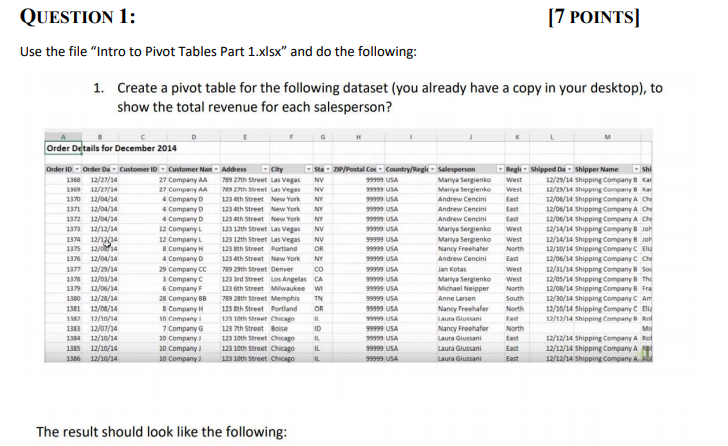
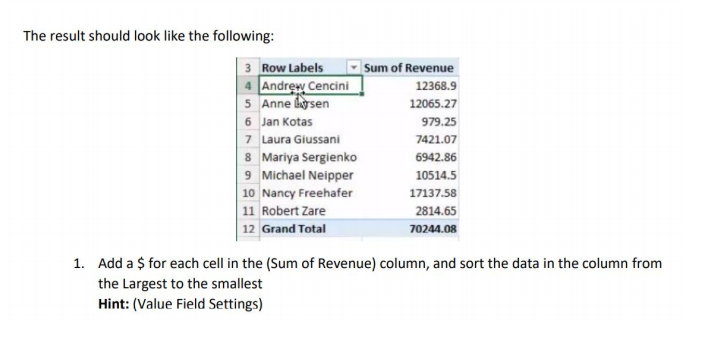
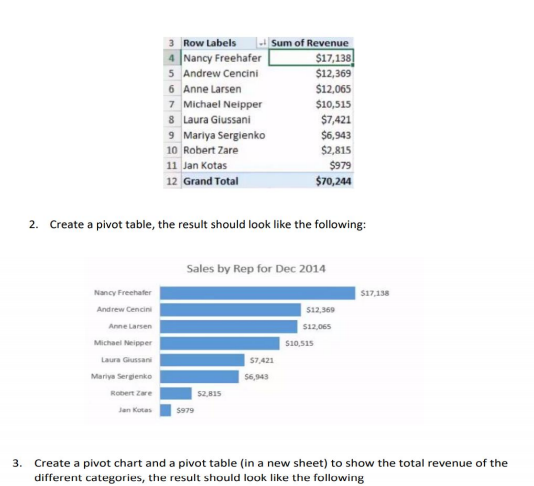
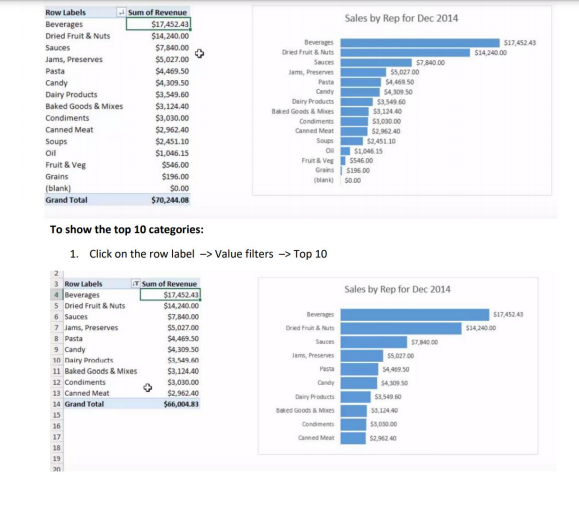
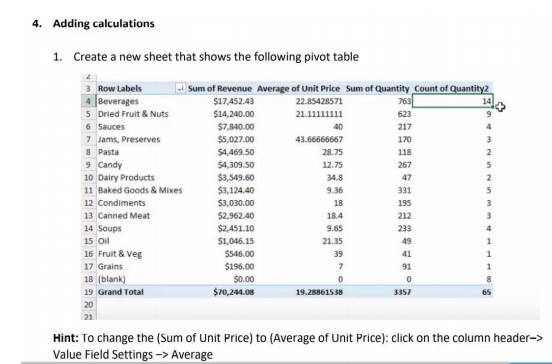

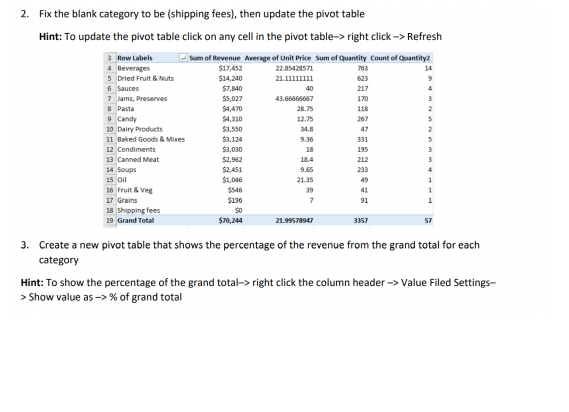
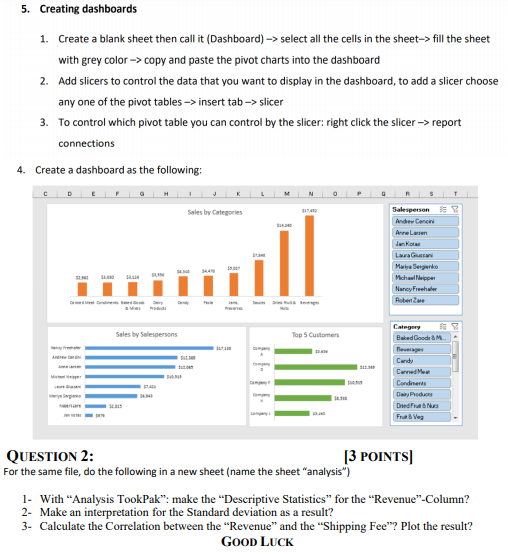
QUESTION 1: [7 POINTS) Use the file "Intro to Pivot Tables Part 1.xlsx" and do the following: 1. Create a pivot table for the following dataset (you already have a copy in your desktop), to show the total revenue for each salesperson? Order Details for December 2014 Order ID Order Da Customer ID - Customer Nan Address Sta ZIP/Postal Cod Country/Regl Salesperson 1368 12/27/14 27 Company AA 789 27th Street Las Vegas NV 99999 USA Mariya Sergienko 1369 12/27/14 27 Company AA 789 27th Street Las Vegas NY 99999 USA Mariya Sergrenko 1370 12/04/14 4 Company 123 th Street New York NY 99999 USA Andrew Cencini 1371 12/04/14 4 Company 123th Street New York NY 999 USA Andrew Cencini 1372 12/04/14 4 Company 1234th Street New York NY 99999 USA Andrew Cencini 1373 12/12/14 12 Company 123 12th Street Las Vegas NV 99999 USA Mariya Serglenko 137 13/12/14 12 Company L 123 12th Street Las Vegas NV 99999 USA Mariya Serglenko 1375 12/04 & Company 123 th Street Portland OR 99999 USA Nancy Freehafer 1376 12/04/14 4 Company 1234th Street New York NY 99999 USA Andrew Cencini 1377 12/29/14 29 Company CC 789 29th Street Denver 99999 USA Jan Kotas 1370 12/03/14 3 Company 1233rd Street Los Angeles CA 99999 USA Mariya Serglenko 1379 12/08/14 6 Company F 123 6th Street Milwaukee W 9999 USA Michael Neipper 1380 12/28/14 28 Company Be 789 28th Street Memphis TN 99999 USA Anne Larsen 1381 12/08/14 8 Company 123th Street Portland OR 9 USA Nancy Freehaler 13 12/10/14 10 Company 1.28 10th Street Chicago 11 Laura Gluscani 1383 12/07/14 7 Company G 123 7th Street Boise ID 99999 USA Nancy Freehafer 1384 12/10/14 10 Company 123 10th Street Chicago IL USA Laura Giussani 1355 12/10/14 10 Company 123 10th Street Chicago IL 99999 USA Laura Giussani 12/10/14 10 Company 123 10th Street Chicago 99999 USA Laura Giussani ReghiShipped Da Shipper Name shi West 12/29/14 Shipping Company B Kar West 12/29/14 Shipping Company B Kar East 12/06/14 Shipping Company A Ch 12/06/14 Shipping Company A Ch 12/06/14 Shipping Company A Che West 12/34/14 Shipping Company B Joh West 12/14/14 Shipping Company B joh North 12/10/14 Shipping Company C Elia East 12/06/14 Shipping Company Che West 12/31/14 Shipping Company B Sox West 12/05/14 Shipping Company B The North 12/08/14 Shipping Company B Fra South 12/30/14 Shipping Company C Am North 12/10/14 Shipping Company lia 12/13/18 Shipping Company Rol North M 12/12/14 Shipping Company A Rol 12/12/14 Shipping Company Al East 12/12/14 Shipping Company Ab The result should look like the following: The result should look like the following: 3 Row Labels Sum of Revenue 4 Andrew Cencini 12368.9 5 Anne lysen 12065.27 6 Jan Kotas 979.25 7 Laura Giussani 7421.07 8 Mariya Sergienko 6942.86 9 Michael Neipper 10514.5 10 Nancy Freehafer 17137.58 11 Robert Zare 2814.65 12 Grand Total 70244.08 1. Add a $ for each cell in the (Sum of Revenue) column, and sort the data in the column from the Largest to the smallest Hint: (Value Field Settings) 3 Row Labels 4 Nancy Freehafer 5 Andrew Cencini 6 Anne Larsen 7 Michael Neipper 8 Laura Giussani 9 Mariya Serglenko 10 Robert Zare 11 Jan Kotas 12 Grand Total Sum of Revenue $17,138 $12,369 $12,065 $10,515 $7,421 $6,943 $2,815 $979 $70,244 2. Create a pivot table, the result should look like the following: Sales by Rep for Dec 2014 $17,138 512,369 $12,065 S10.515 Nancy Freehafer Andrew Cencini Anne Larsen Michael Nipper Laura Giussani Mariya Serglenko Robert Zare Jan Kotas 57,421 56,943 52.815 5979 3. Create a pivot chart and a pivot table in a new sheet) to show the total revenue of the different categories, the result should look like the following Sales by Rep for Dec 2014 517,45243 514.240.00 Row Labels - Sum of Revenue Beverages $17,452.43 Dried Fruit & Nuts $14,240.00 Sauces $7,840.00 Jams, Preserves $5,027.00 Pasta $4,469.50 Candy $4,309.50 Dairy Products $3,549.60 Baked Goods & Mixes $3,124.40 Condiments $3,030,00 Canned Meat $2,962.40 Soups $2.451.10 Oil $1,046.15 Fruit & Veg $546,00 Grains $196.00 (blank) $0.00 Grand Total $70,241.08 Beverages Dried Fruit & Nuts Sauce 57,840.00 Jam, Preserve $5,027.00 Pasta 54,4600 S4309 50 Dairy Products 59.549.60 Baked Goods & Me $31244 Condiments $1,000.00 Canned Meat 52,962.40 52.451.10 Os 51,046.15 Fruit & Veg $546,00 Gr 5196.00 blank 50.00 To show the top 10 categories: 1. Click on the row label -> Value filters -> Top 10 Sales by Rep for Dec 2014 517,45243 514.240.00 Beverages Dried Fruit & Sauces JamsPreserves 3 Row Labels IT Sum of Revenue 4 Beverages $17.452.43 5 Dried Fruit & Nuts $14,200.00 6 Sauces $7,840.00 7 Jams, Preserves $5,027.00 8 Pasta S4.469.50 9 Candy $4,309.50 10 Dairy Products $8.549.00 11 Baked Goods & Mixes $3,124.40 12 Condiments $3,030.00 13 Canned Meat $2.962.40 14 Grand Total $66,001,83 15 16 17 18 19 an 57,340.00 55.627.00 54,409.50 54309 50 53.549 58.140 $5,000.00 52.96240 Dairy Products Boxed Goods & Me Condiments Cannede 4. Adding calculations 1. Create a new sheet that shows the following pivot table 118 3 Row Labels Sum of Revenue Average of Unit Price Sum of Quantity Count of Quantity2 4 Beverages $17.452.43 22.85428571 763 14 5 Dried Fruit & Nuts $14,240.00 21.11111111 623 6 Sauces $7,840.00 40 217 7 Jams, Preserves $5,027.00 43.66666667 170 8 Pasta $4,469.50 28.75 9 Candy $4,309.50 12.75 267 5 10 Dairy Products $3,549.60 34.8 47 2 11 Baked Goods & Mixes $3,124.40 9.36 331 5 12 Condiments $3,030.00 18 195 3 13 Canned Meat $2,962.40 18.4 212 3 14 Soups $2,451.10 233 4 15 Oil $1,046.15 21.35 49 1 16 Fruit & Veg $546,00 39 41 17 Grains $196.00 7 91 18 (blank) $0.00 0 0 19 Grand Total $70,241.08 19.28861538 3357 20 21 Hint: To change the (Sum of Unit Price) to (Average of Unit Price): click on the column header-> Value Field Settings -> Average 9.65 2. Fix the blank category to be (shipping fees), then update the pivot table Hint: To update the pivot table click on any cell in the pivot table-> right click -> Refresh Row Labels Sum of Revenue Average of Unit Price Sum of Quantity Count of Quantity 4 Beverages $17,452 22.85428571 763 14 5 Dried Fruit & Nuts $14,240 21.11111111 623 6 Sauces $7,840 40 217 7 Jams, Preserves $5,027 43.66666667 170 3 8 Pasta $4,470 28.75 118 2 $4,310 12.75 267 10 Dairy Products $1.550 M. 47 11 Baked Goods & Mixes $3,124 9.36 331 12 Condiments $3,030 195 3 13 Canned Meat $2,962 18.4 212 14 Soups $2.451 9.65 233 15 Oil $1,046 21.15 49 16 Fruit & Veg $546 39 41 17 Grains $190 7 91 18 Shipping fees $0 19 Grand Total $70,244 21.99578947 3357 57 9 Candy 18 3. Create a new pivot table that shows the percentage of the revenue from the grand total for each category Hint: To show the percentage of the grand total-> right click the column header -> Value Filed Settings- > Show value as > % of grand total 2. Fix the blank category to be (shipping fees), then update the pivot table Hint: To update the pivot table click on any cell in the pivot table-> right click -> Refresh Row Labels Sum of Revenue Average of Unit Price Sum of Quantity Count of Quantity 4 Beverages $17,452 22.85428571 763 14 5 Dried Fruit & Nuts $14,240 21.11111111 623 6 Sauces $7,840 40 217 7 Jams, Preserves $5,027 43.66666667 170 3 8 Pasta $4,470 28.75 118 2 $4,310 12.75 267 10 Dairy Products $1.550 M. 47 11 Baked Goods & Mixes $3,124 9.36 331 12 Condiments $3,030 195 3 13 Canned Meat $2,962 18.4 212 14 Soups $2.451 9.65 233 15 Oil $1,046 21.15 49 16 Fruit & Veg $546 39 41 17 Grains $190 7 91 18 Shipping fees $0 19 Grand Total $70,244 21.99578947 3357 57 9 Candy 18 3. Create a new pivot table that shows the percentage of the revenue from the grand total for each category Hint: To show the percentage of the grand total-> right click the column header -> Value Filed Settings- > Show value as > % of grand total 5. Creating dashboards 1. Create a blank sheet then call it (Dashboard) -> select all the cells in the sheet-> fill the sheet with grey color -> copy and paste the pivot charts into the dashboard 2. Add slicers to control the data that you want to display in the dashboard, to add a slicer choose any one of the pivot tables -> insert tab -> slicer 3. To control which pivot table you can control by the slicer: right click the slicer -> report connections 4. Create a dashboard as the following: Sales by Categories Salespersen Andrew Cencini Annelen dan ko Low Maya Bengerie Michael Moppet Nancy Fresh Robert Category Sales by Salespersons Top 5 Customers . Baked Goede Beweg Candy Carned Most Cordnenis Day Products Dedra Nus Fruit & Ves QUESTION 2: [3 POINTS For the same file, do the following in a new sheet (name the sheet "analysis) 1. With "Analysis TookPak: make the "Descriptive Statistics for the "Revenue"-Column? 2- Make an interpretation for the Standard deviation as a result? 3- Calculate the Correlation between the Revenue" and the "Shipping Fee"? Plot the result? GOOD LUCK


