

Question: Question 1 9 pts For each research question, identify the appropriate statistical procedure. Test whether the mean yield for an acre of corn is less
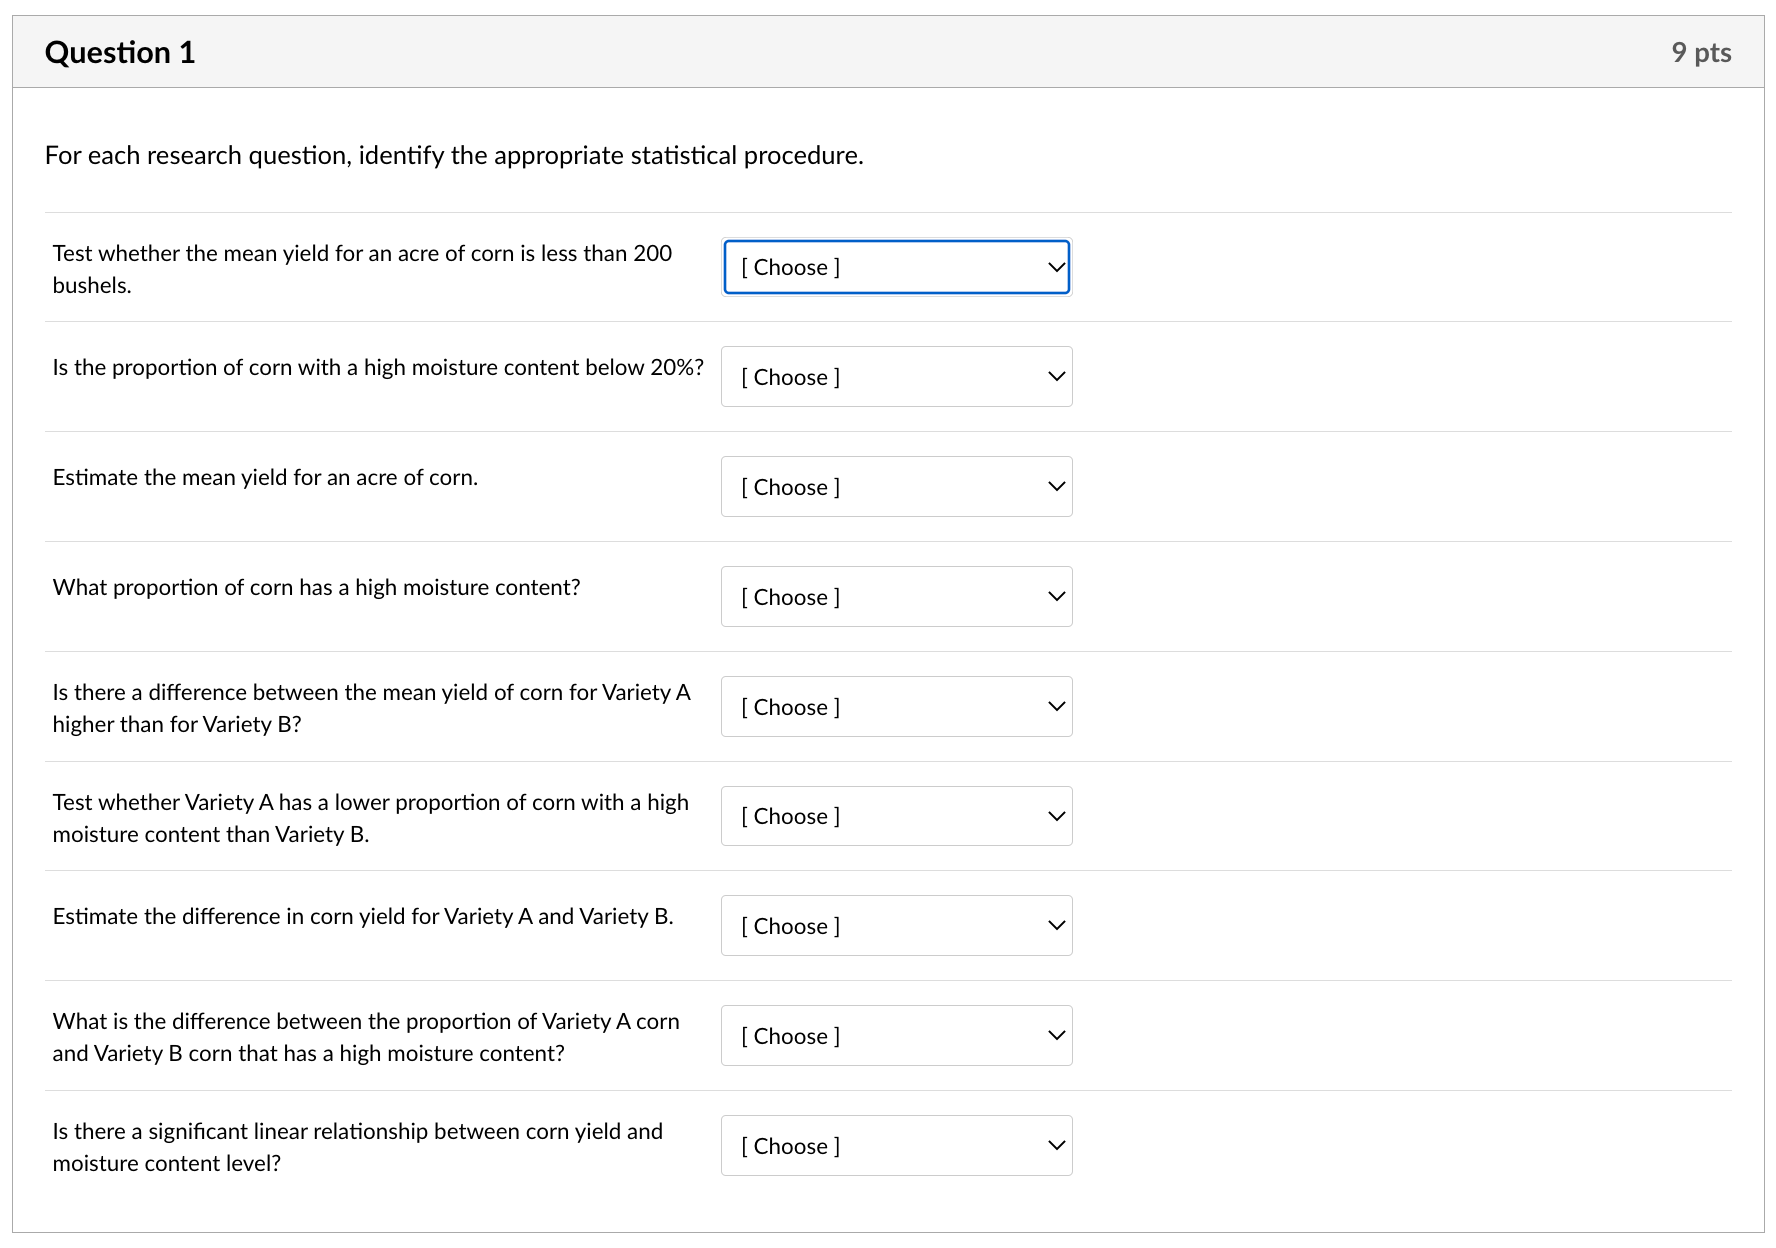
![is less than 200 [ Choose ] bushels. Is the proportion of](https://dsd5zvtm8ll6.cloudfront.net/si.experts.images/questions/2024/10/671b889bde001_691671b889b92687.jpg)
![corn with a high moisture content below 20%? [ Choose ] Estimate](https://dsd5zvtm8ll6.cloudfront.net/si.experts.images/questions/2024/10/671b889db7672_693671b889d71adf.jpg)
![the mean yield for an acre of corn. [ Choose ] V](https://dsd5zvtm8ll6.cloudfront.net/si.experts.images/questions/2024/10/671b889faa41d_695671b889f5c2e1.jpg)
![What proportion of corn has a high moisture content? [ Choose ]](https://dsd5zvtm8ll6.cloudfront.net/si.experts.images/questions/2024/10/671b88a1d1b94_697671b88a17f5c1.jpg)
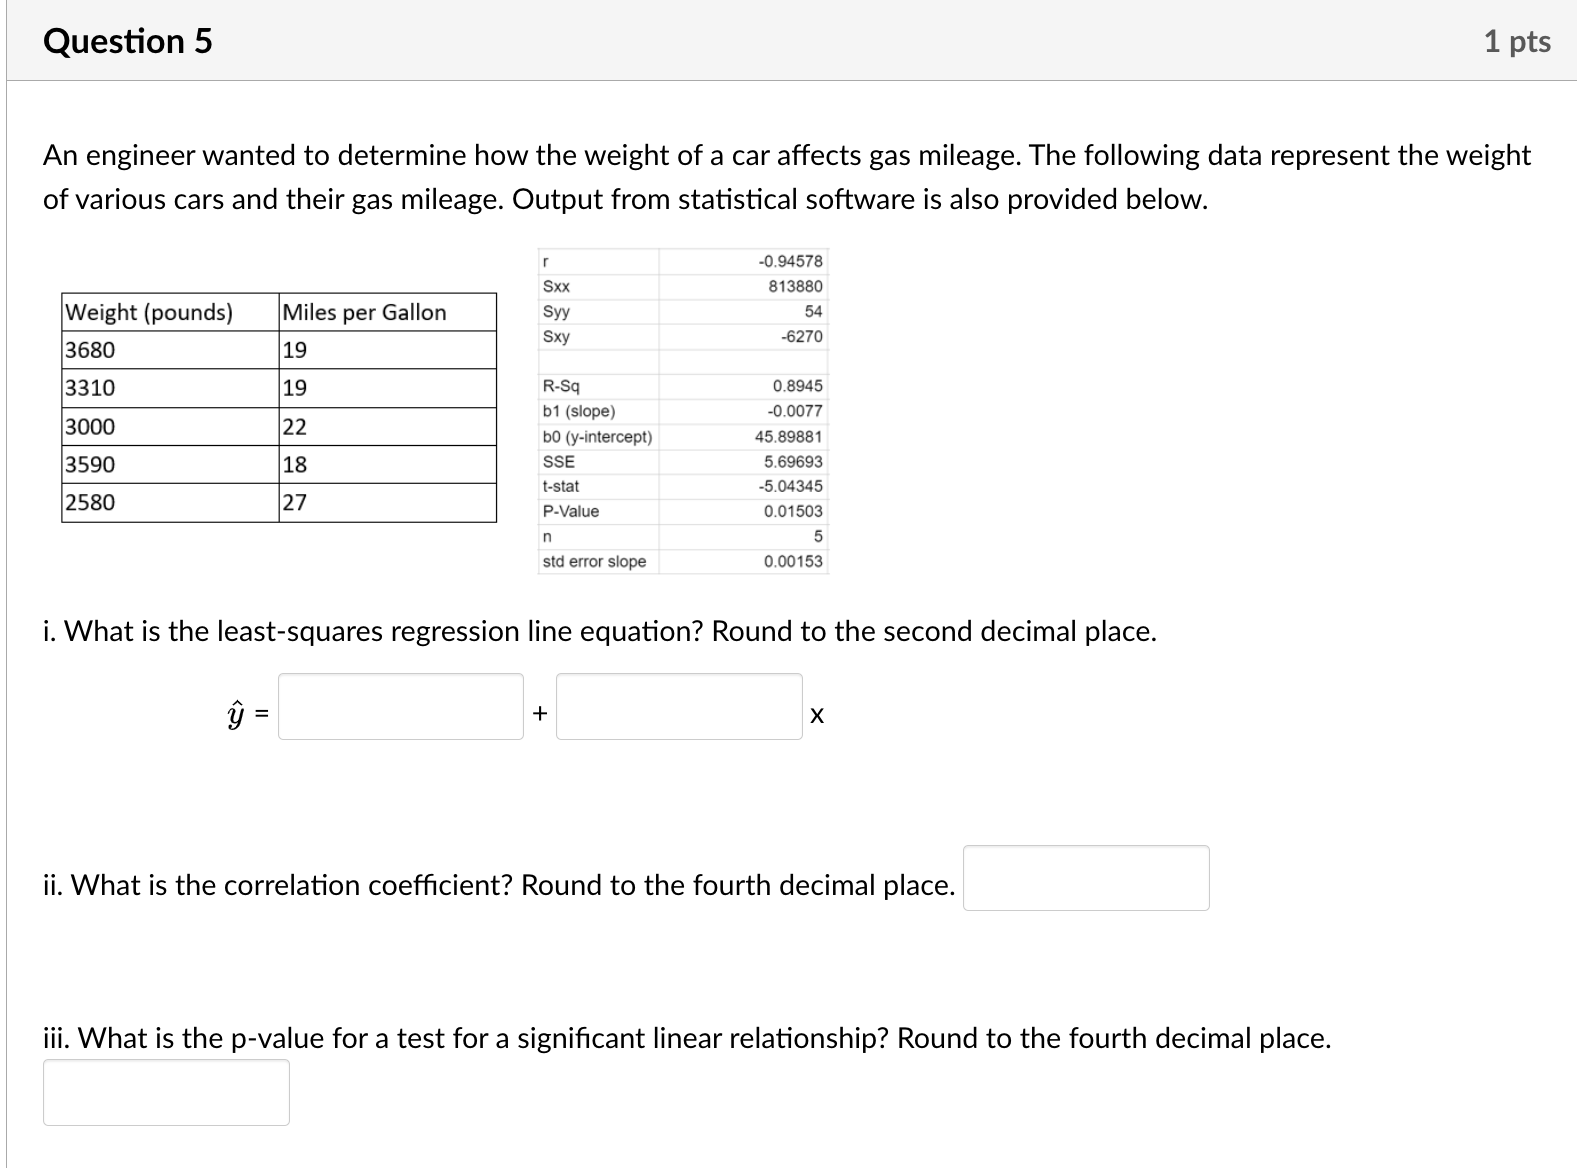
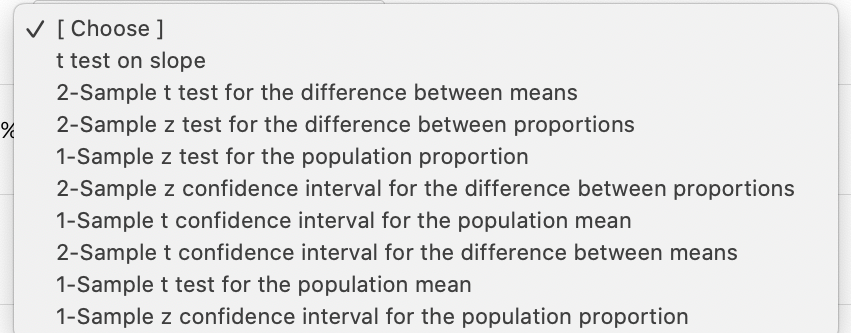
Question 1 9 pts For each research question, identify the appropriate statistical procedure. Test whether the mean yield for an acre of corn is less than 200 [ Choose ] bushels. Is the proportion of corn with a high moisture content below 20%? [ Choose ] Estimate the mean yield for an acre of corn. [ Choose ] V What proportion of corn has a high moisture content? [ Choose ] V Is there a difference between the mean yield of corn for Variety A [ Choose ] higher than for Variety B? Test whether Variety A has a lower proportion of corn with a high [ Choose ] moisture content than Variety B. Estimate the difference in corn yield for Variety A and Variety B. [ Choose ] v What is the difference between the proportion of Variety A corn [ Choose ] and Variety B corn that has a high moisture content? Is there a significant linear relationship between corn yield and [ Choose ] moisture content level?v' [ Choose ] ttest on slope 2Sample t test for the difference between means 2Sample 2 test for the difference between proportions 1Sample 2 test for the population proportion 2Sample z confidence interval for the difference between proportions 1Sample t confidence interval for the population mean 2Sample t confidence interval for the difference between means 1Sample t test for the population mean 1Sample z confidence interval for the population proportion Question 2 A study conducted at the University of Denver investigated whether babies take longer to learn to crawl in cold months, when they are often 3 pts bundled in clothes that restrict their movement, than in warmer months. A scatterplot of the crawling age of babies and the average temperature when the babies are six months old (that's when babies often begin trying to crawl). Temperature is measured in degrees Fahrenheit and age is measured in weeks. 34 . g 33 . E o g) 32* . m I U) E 317 g . E o _ $1 30 . E 29- . l l l l l 30 40 50 50 70 Temperature (in F) i. What is the form of the relationship? [Select] ii. What is the direction of the relationship? l 59'3\"] iii. What is the strength of the relationship? [53'8\"] Question 3 A nutritionist is studying the amount of fat (in grams) and number of calories in fast food cheeseburgers. From the websites of eight randomly selected fast food restaurants. the nutritionist obtains the data given below. Fat Content (grams), x 20 39 27 29 26 47 35 38 Caiories.y 400 750 480 540 510 760 690 632 i. What is the correlation coefcient? Round your answer to three decimal places. if necessary. ii. Which of the following is a correct interpretation of r2? Type A. B, C, or D. A. 94.8% of the variation in calories is explained by fat content. B. 94.8% of the variation in fat content is explained by calories. C. 89.8% of the variation in calories is explained by fat content. D. 89.8% of the variation in fat content is explained by calories. iii. What is the regression equation? Round the values to three decimal places. if necessary. :97: + m iv. Which of the following is a correct interpretation of the slope of the regression equation? Type A. B. C. or D. A. For each additional gram of fat content, fast food cheeseburgers have 14448 additional calories on average. B. For each additional gram of fat content, fast food cheeseburgers have 123.877 additional calories on average. C. For each additional calorie. fast food cheeseburgers have 14.448 additional grams of fat on average. D. For each additional calorie, fast food cheeseburgers have 123.877 additional grams of fat on average. v. Which of the following is a correct interpretation of the intercept of the regression equation? Type A, B, C' or D. A. Fast food cheeseburgers with zero calories are expected to have 14.448 grams of fat. This interpretation is appropriate to make. B. Fast food cheeseburgers with zero calories are expected to have 123.877 grams of fat. This interpretation is not appropriate to make. C. Fast food cheeseburgers with zero grams of fat are expected to have 14.448 calories. This interpretation is appropriate to make. D. Fast food cheeseburgers with zero grams of fat are expected to have 123.877. This interpretation is not appropriate to make. vi. Perform a tstest on the slope of the regression equation. What is the test statistic? Round your answer to three decimal places. if necessary. What is the pevalue? Round your answer to four decimal places. if necessary. What is the appropriate conclusion? Type A, B, C, or D. A. At (1 = 0.01, there is not a signicant linear relationship between fat content and calories of fast food cheeseburgers. B. At :1 = 0.01. there is a significant linear relationship between fat content and calories of fast food cheeseburgers. C.At r1 = 0.05, there is not a signicant linear relationship between fat content and calories of fast food cheeseburgers. D. At :1 = 0.05. it is impossible to tell whether there is a signicant linear relationship between fat content and calories of fast food cheeseburgers. vii. Predict the calories for a hamburger with 30 grams of fat. Round your answer to three decimal places. ortype "inappropriate" if it is not appropriate to make this prediction. viii. Predict the calories for a hamburger with 11 grams offat. Round your answer to three decimal places. or type "inappropriate" if it is not appropriate to make this prediction. Question 4 2 pts The Great Britain Office of Population Census and Surveys once collected data on a random sample of 170 married couples in Britain, recording the age (in years) of the husbands and wives. The data are displayed in the scatterplot below. 60 Wife's age (in years) 40 20 8 20 40 60 Husband's age (in years) i. What would happen if a new couple were added to the scatterplot where the husband was 60 years old and the wife was 25 years old? [ Select ] ii. What would happen if a new couple were added to the scatterplot where the husband and wife were both 80 years old? [ Select ]~/ [ Select] I The correlation coefficient would increase, the slope would decrease, and the intercept would increase. The correlation coefficient would decrease, the slope would decrease, and the intercept would increase. i_ The correlation coefficient would decrease, but the slope and intercept would not change. The correlation coefficient would not change, but the slope and intercept would both increase. Question 5 1 pts An engineer wanted to determine how the weight of a car affects gas mileage. The following data represent the weight of various cars and their gas mileage. Output from statistical software is also provided below. -0.94578 Sxx 813880 Weight (pounds) Miles per Gallon Syy 54 Sxy 6270 3680 19 3310 19 R-Sq 0.8945 b1 (slope) 0.0077 3000 22 bo (y-intercept) 45.89881 3590 18 SSE 5.69693 t-stat -5.04345 2580 27 P-Value 0.01503 std error slope 0.00153 i. What is the least-squares regression line equation? Round to the second decimal place. y = X ii. What is the correlation coefficient? Round to the fourth decimal place. iii. What is the p-value for a test for a significant linear relationship? Round to the fourth decimal place
Step by Step Solution
There are 3 Steps involved in it

Get step-by-step solutions from verified subject matter experts