

Question: question 1: A - E Chapter 1, Problem 1P 9 Bookmarks Show all steps: ON Chapter 1, Problem IP 9 Bookmarks Show all steps: Suppose
 question 1: A - E
Chapter 1, Problem 1P 9 Bookmarks Show all steps: ON
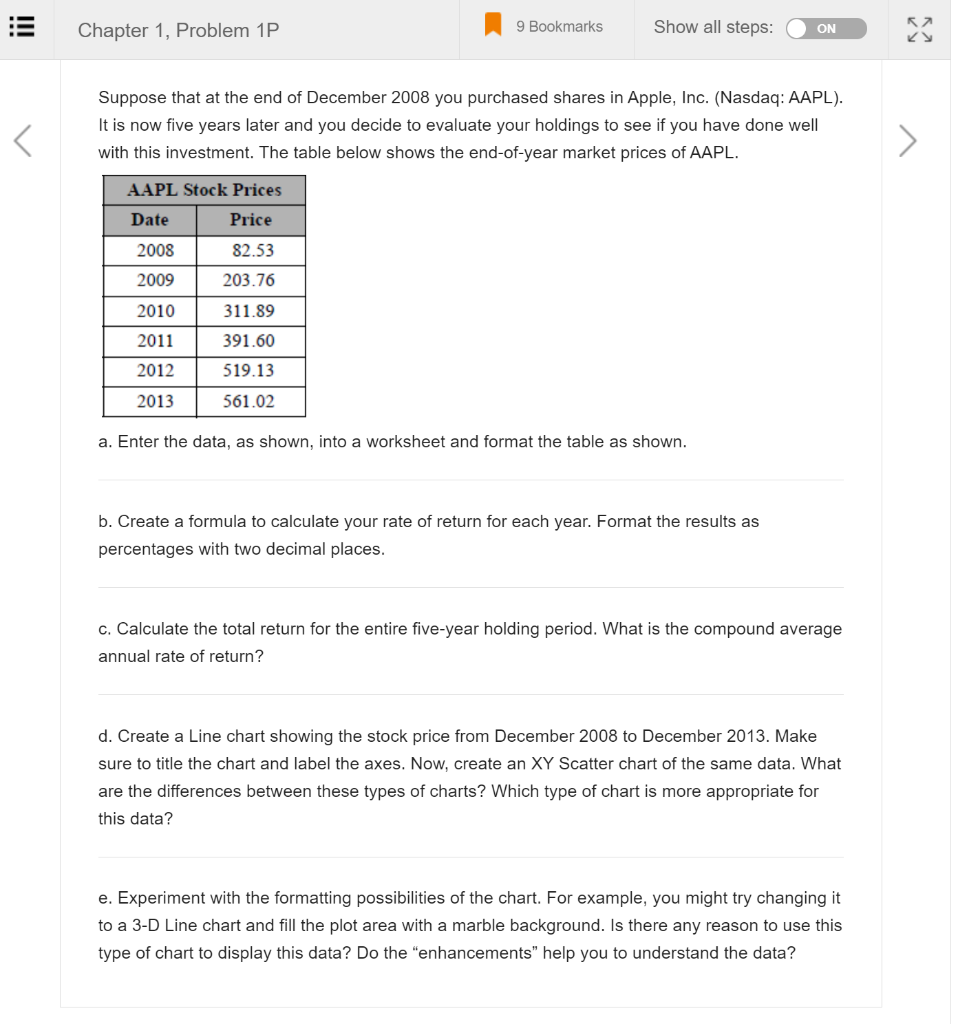
Chapter 1, Problem IP 9 Bookmarks Show all steps: Suppose that at the end of December 2008 you purchased shares in Apple, Inc. (Nasdaq: AAPL). It is now five years later and you decide to evaluate your holdings to see if you have done well with this investment. The table below shows the end-of-year market prices of AAPL. AAPL Stock Prices Date 2008 2009 2010 2011 2012 2013 Price 82.53 203.76 311.89 391.60 519.13 561.02 a. Enter the data, as shown, into a worksheet and format the table as shown. b. Create a formula to calculate your rate of return for each year. Format the results as percentages with two decimal places. c. Calculate the total return for the entire five-year holding period. What is the compound average annual rate of return? d. Create a Line chart showing the stock price from December 2008 to December 2013. Make sure to title the chart and label the axes. Now, create an XY Scatter chart Of the same data. What are the differences between these types of charts? Which type of chart is more appropriate for this data? e. Experiment with the formatting possibilities Of the chart. For example, you might try changing it to a 3-D Line chart and fill the plot area with a marble background. Is there any reason to use this type of chart to display this data? Do the "enhancements" help you to understand the data?
Step by Step Solution
There are 3 Steps involved in it

Get step-by-step solutions from verified subject matter experts