

Question: Question 1: A quality control team is inspecting a variety of vaccine attributes. They take five samples each time they go out to the production
Question 1:
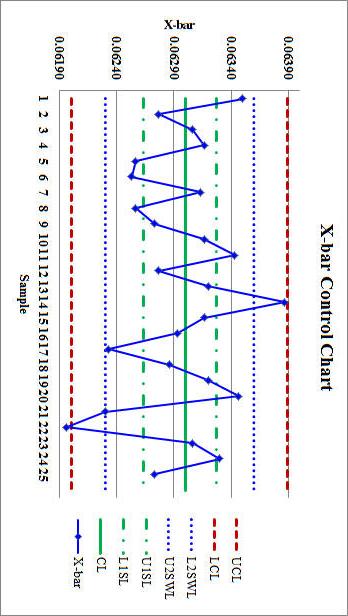
A quality control team is inspecting a variety of vaccine attributes. They take five samples each time they go out to the production line. After testing each sample for active ingredient levels, they record their data and plot the data using Statistical Process Control Charts.
Which of the following is true? (check all that applies)
Question 1 options:
|
|
Special cause variation is represented in the graph.
|
|
|
X-bar Control Chart to monitor the mean of your process when you have continuous data
|
|
|
The process is in control because data points vary randomly around the center line and are outside the control limits.
|
|
|
The process is in control because data points fall within the upper and lower control limits.
|
|
|
The process exhibits common cause variation and is stable.
|
V hnw rnmtwnl r1hnw
Step by Step Solution
There are 3 Steps involved in it

Get step-by-step solutions from verified subject matter experts