

Question: QUESTION 1 a) The following stem-and-leaf plot describes the weekly expenses of a sample of primary school students in Sekolah Kebangsaan Sg. Tuang, Melaka. Stem
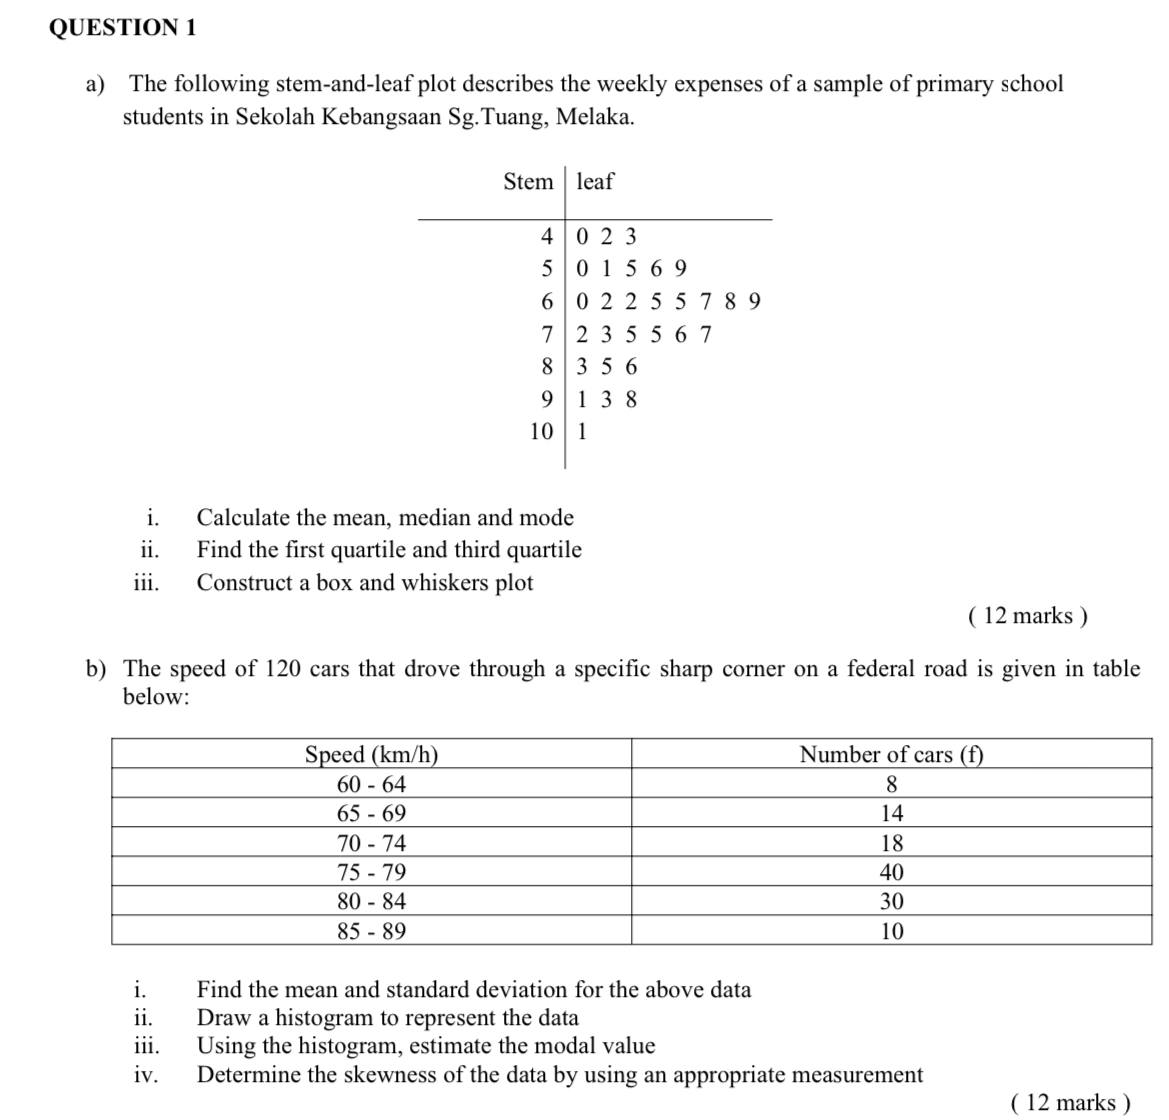

QUESTION 1 a) The following stem-and-leaf plot describes the weekly expenses of a sample of primary school students in Sekolah Kebangsaan Sg. Tuang, Melaka. Stem leaf 4 023 5 01569 6 0 2 2 5 5 789 7 23 5 567 8 35 6 9 13 8 10 1 . Calculate the mean, median and mode ii. Find the first quartile and third quartile iii. Construct a box and whiskers plot ( 12 marks ) b) The speed of 120 cars that drove through a specific sharp corner on a federal road is given in table below: Speed (km/h) Number of cars (f) 60 - 64 8 65 - 69 14 70 - 74 18 75 - 79 40 80 - 84 30 85 - 89 10 Find the mean and standard deviation for the above data ii. Draw a histogram to represent the data iii. Using the histogram, estimate the modal value iv . Determine the skewness of the data by using an appropriate measurement ( 12 marks )
Step by Step Solution
There are 3 Steps involved in it

Get step-by-step solutions from verified subject matter experts