

Question: Question 1) Based on the above case study, please prepare proforma income statement for Systech. Question 1) Based on the case study, please prepare proforma
Question 1) Based on the above case study, please prepare proforma income statement for Systech.
Question 1) Based on the case study, please prepare proforma income statement for Systech.
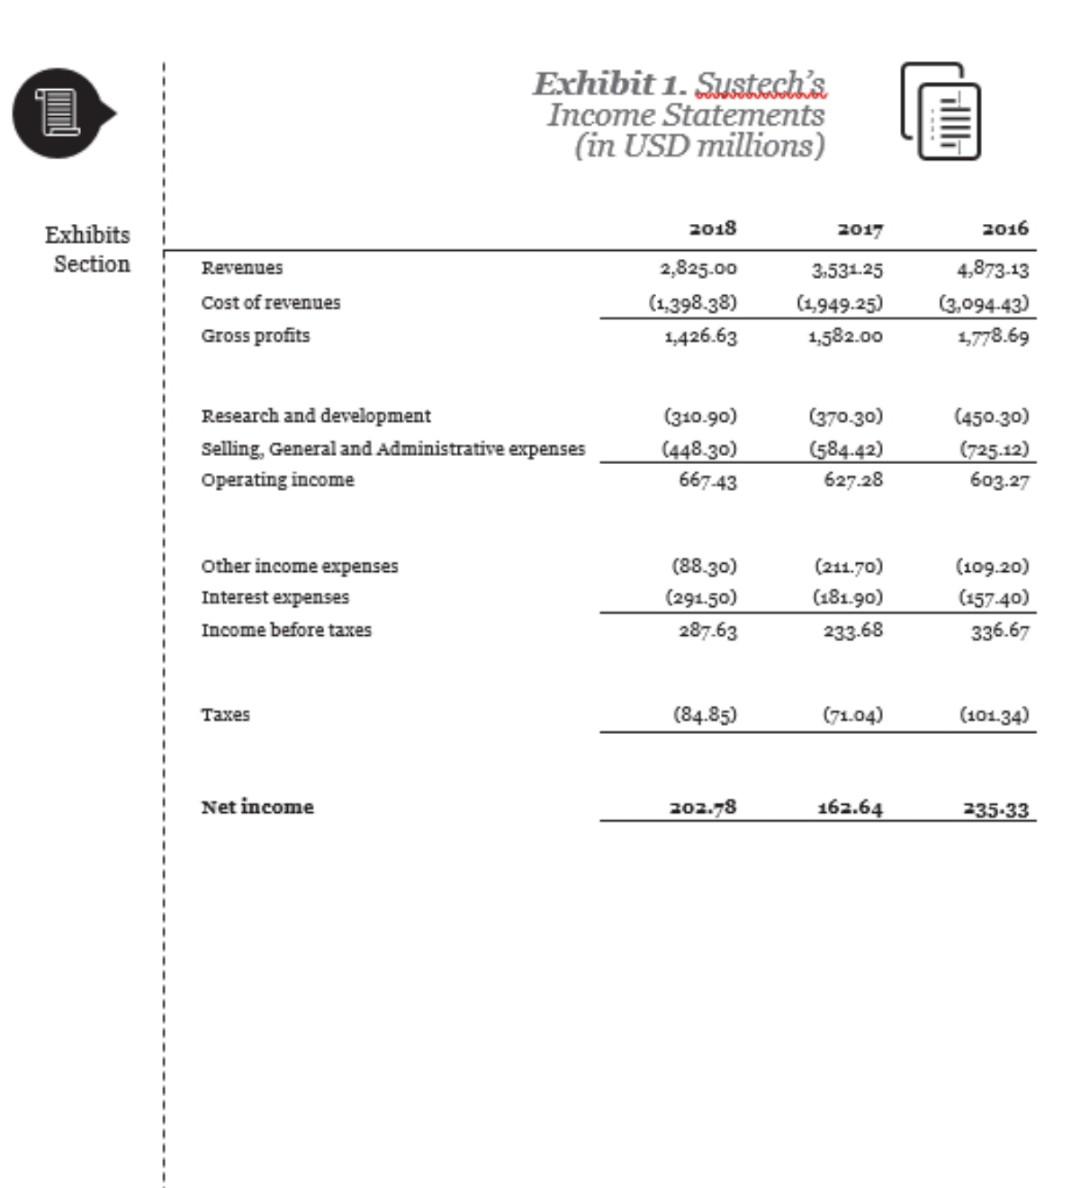
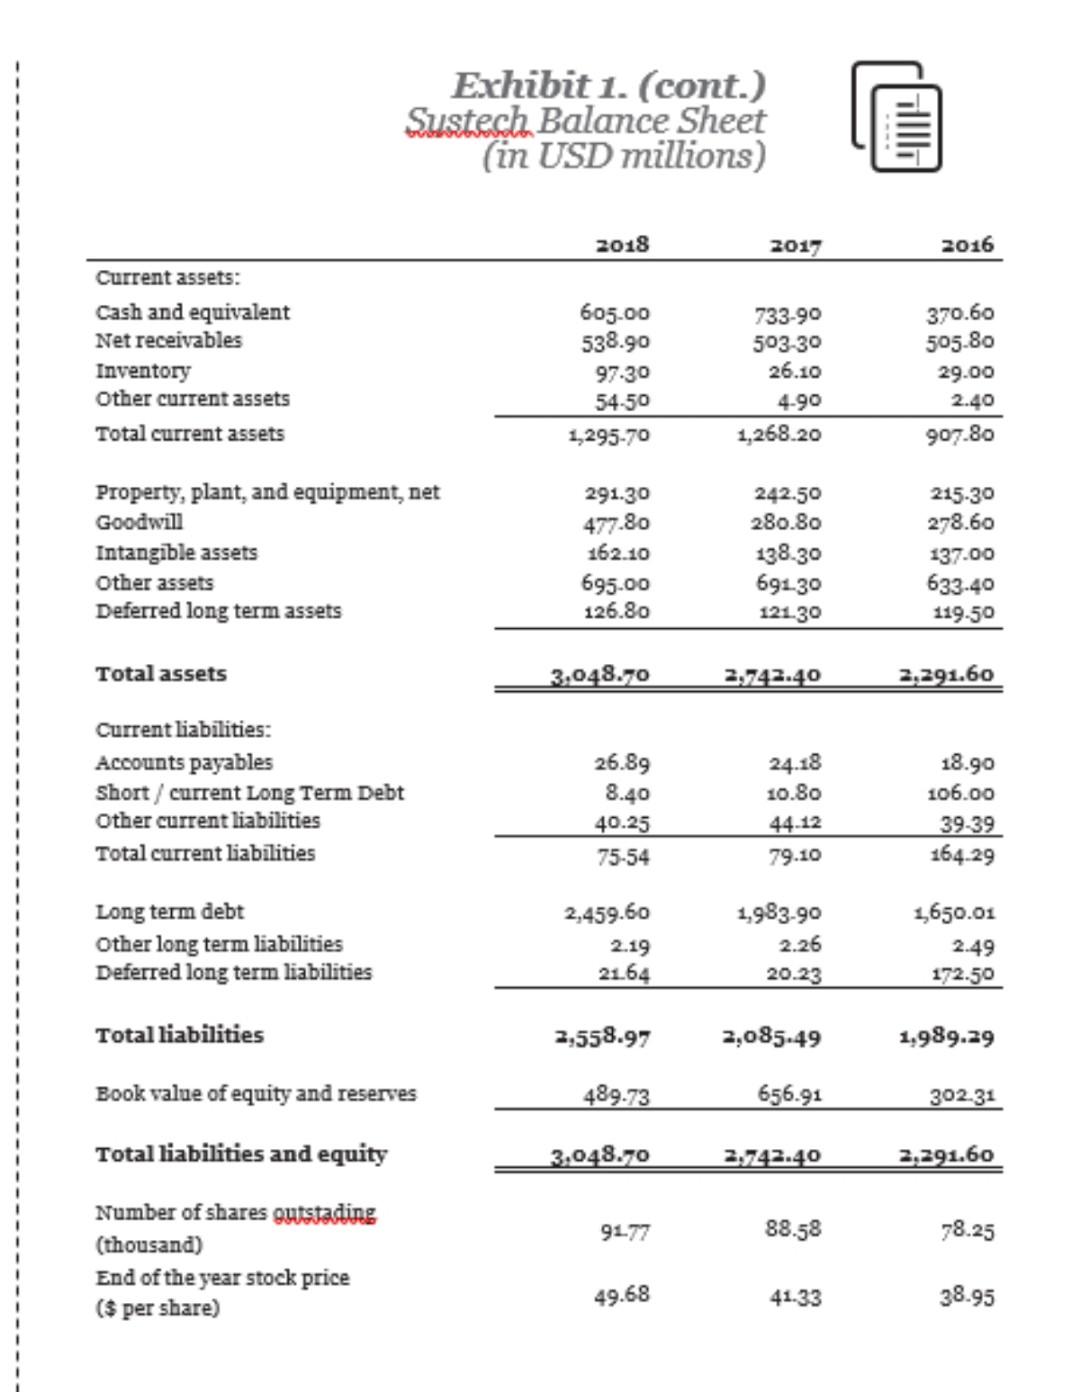
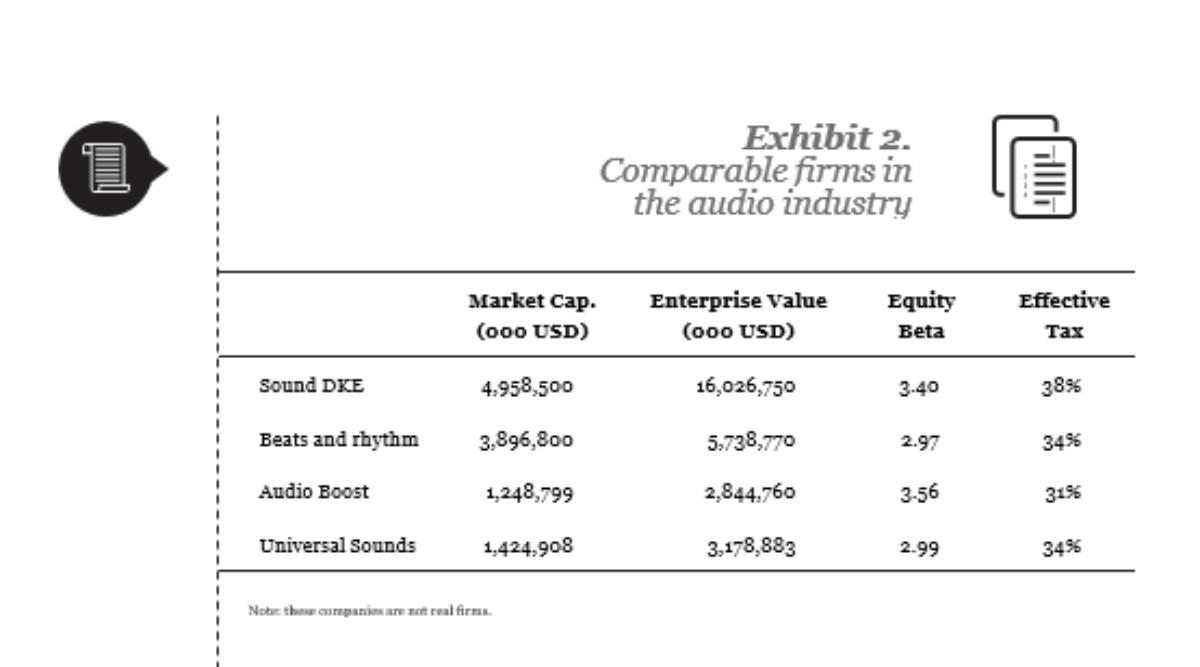
Exhibit 1. Sustech's Income Statements (in USD millions) Hall 2018 2017 2016 Exhibits Section Revenues Cost of revenues Gross profits 2,825.00 (1,398.38) 1,426.63 3,531.25 (1,949.25) 1,582.00 4,873-13 (3,094.43) 1778.69 Research and development Selling, General and Administrative expenses Operating income (310.90) (448.30) 667-43 (370-30) (584.42) 627-28 (450-30) (725.12) 603.27 Other income expenses Interest expenses Income before taxes (88.30) (291.50) 287.63 (211.70) (181.90) 233.68 (109.20) (157.40) 336.67 Taxes (84.85) (71.04) (101.34) Net income 202.78 162.64 235-33 Exhibit 1. (cont.) Sustech Balance Sheet (in USD millions) illlli 2018 2017 2016 Current assets: Cash and equivalent Net receivables Inventory Other current assets Total current assets 605.00 538.90 97.30 54-50 1,295-70 733-90 503-30 26.10 4.90 1,268.20 370.60 505.80 29.00 2.40 907.80 Property, plant, and equipment, net Goodwill Intangible assets Other assets Deferred long term assets 291.30 477.80 162.10 695.00 126.80 242.50 280.80 138.30 691-30 121.30 215-30 278.60 137.00 633.40 119-50 Total assets 3,048.70 2,742.40 2,291.60 26.89 Current liabilities: Accounts payables Short / current Long Term Debt Other current liabilities Total current liabilities 8.40 40.25 75-54 24.18 10.80 44.12 79.10 18.90 106.00 39-39 164.29 Long term debt Other long term liabilities Deferred long term liabilities 2,459.60 2.19 21.64 1,983-90 2.26 20.23 1,650.01 2.49 172.50 Total liabilities 2,558.97 2,085-49 1,989.29 489.73 656.91 302.31 Book value of equity and reserves Total liabilities and equity 3,048.70 2.742.40 2,291.60 91.77 88.58 78.25 Number of shares outstading (thousand) End of the year stock price ($ per share) 49.68 41.33 38.95 Exhibit 2. Comparable firms in the audio industry Hall Market Cap. (ooo USD) Enterprise Value (000 USD) Equity Beta Effective Tax Sound DKE 4,958,500 16,026,750 3.40 38% Beats and rhythm 3,896,800 5,738,770 2.97 34% Audio Boost 1,248,799 2,844.760 3-56 3156 Universal Sounds 1,424,908 3,178,883 2.99 3496 Nobic the companie trual firme
Step by Step Solution
There are 3 Steps involved in it

Get step-by-step solutions from verified subject matter experts