

Question: Summarize sales by month and sales division using a pivot table in Excel (hint: put divisions in columns, months in rows) or using a graph
Summarize sales by month and sales division using a pivot table in Excel (hint: put divisions in columns, months in rows) or using a graph or chart in Tableau. If you are using Excel to summarize, you will first need to add a column to the Excel worksheet and extract the "month" portion of the shipping date in order to summarize by month. If you are using Excel, use the "graph" feature to graph the pivot table data. Identify any divisions or months that you believe should be examined further, and document your rationale.
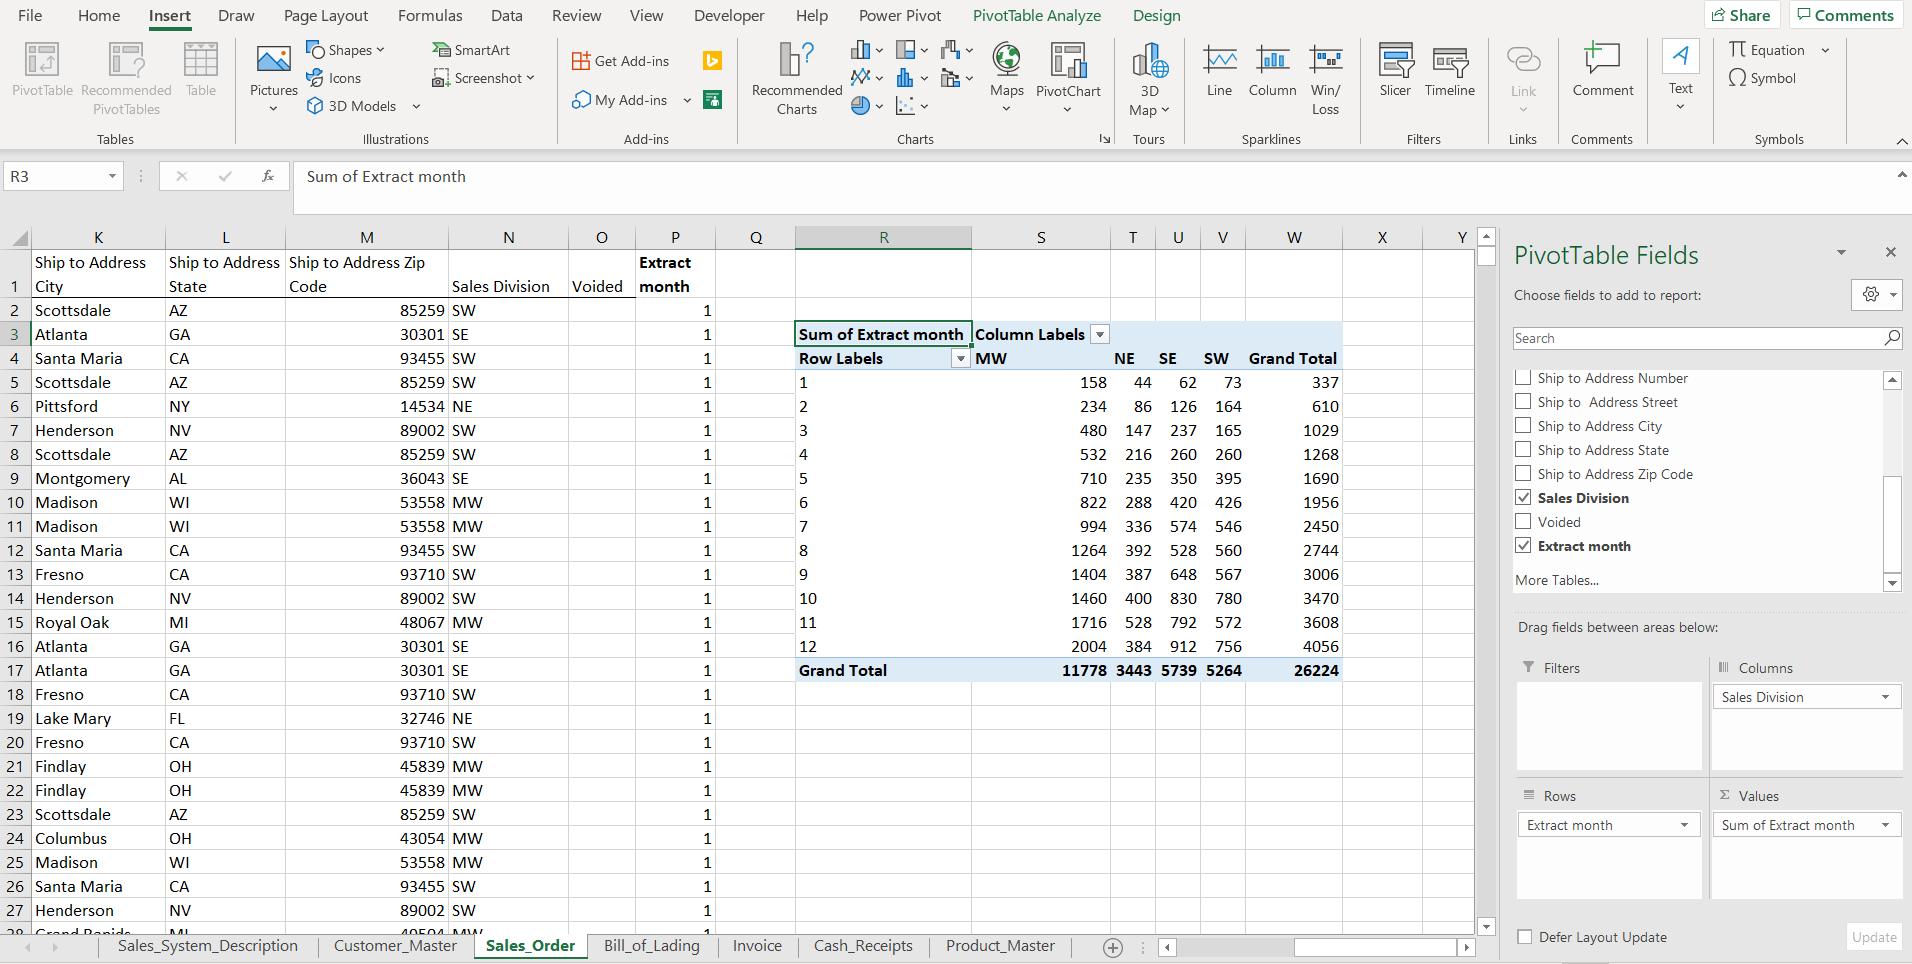 (I've done the pivot table, but not sure where the graph feature is, or the rest of the question)
(b) For any divisions identified in step 2 for follow-up, summarize sales by customer and month using a pivot table in Excel or graph or chart in Tableau. You can use a "filter" in Excel or Tableau to limit the analysis to one or more divisions. Identify any months that you want to examine further, and document your rationale.
(c) Summarize your findings in a brief memo to the manager and include the charts or graphs generated in steps 2 and 3 above as support for your findings. Discuss your recommendations for performing further audit procedures.
File Home Insert Draw Page Layout Formulas Data Review View Developer Help Power Pivot PivotTable Analyze Design A Share O Comments LO Shapes A SmartArt Tt Equation ale A Get Add-ins O Icons O. Screenshot v Q Symbol PivotTable Recommended Table Pictures Recommended Maps PivotChart 3D Line Column Win/ Slicer Timeline Link Comment Text O 3D Models O My Add-ins PivotTables Charts Loss Tables Illustrations Add-ins Charts Tours Sparklines Filters Links Comments Symbols R3 fe Sum of Extract month K M N P R T U V W X PivotTable Fields Ship to Address Ship to Address Ship to Address Zip Extract 1 City State Code Sales Division Voided month Choose fields to add to report: 2 Scottsdale AZ 85259 SW 1 Sum of Extract month Column Labels - 3 Atlanta 4 Santa Maria GA 30301 SE 1 Search CA 93455 SW 1 Row Labels v MW NE SE SW Grand Total 5 Scottsdale AZ 85259 SW 1 1 158 44 62 73 337 O Ship to Address Number 6 Pittsford NY 14534 N 1 234 86 126 164 610 Ship to Address Street 7 Henderson NV 89002 SW 1 480 147 237 165 1029 Ship to Address City 8 Scottsdale AZ 85259 SW 1 4 532 216 260 260 1268 Ship to Address State O Ship to Address Zip Code 9 Montgomery 10 Madison 11 Madison AL 36043 SE 1 710 235 350 395 1690 WI 53558 MW 1 6. 822 288 420 426 1956 V Sales Division WI 53558 MW 1 7 994 336 574 546 2450 O Voided 12 Santa Maria CA 93455 SW 1 8 1264 392 528 560 2744 V Extract month 13 Fresno CA 93710 SW 1 9 1404 387 648 567 3006 More Tables. 14 Henderson 15 Royal Oak 16 Atlanta NV 89002 SW 1 10 1460 400 830 780 3470 MI 48067 MW 1 11 1716 528 792 572 3608 Drag fields between areas below: GA 30301 SE 1 12 2004 384 912 756 4056 17 Atlanta GA 30301 SE 1 Grand Total 11778 3443 5739 5264 26224 Y Filters Columns 18 Fresno CA 93710 SW 1 Sales Division 19 Lake Mary FL 32746 NE 1 20 Fresno CA 93710 SW 1 21 Findlay 22 Findlay OH 45839 MW 1 OH 45839 MW 1 E Rows E Values 23 Scottsdale AZ 85259 SW 1 Extract month Sum of Extract month 24 Columbus 25 Madison 26 Santa Maria 27 Henderson OH 43054 MW 1 WI 53558 MW 1 CA 93455 SW 1 NV 89002 SW 20Crand Denide O Defer Layout Update Update Sales_System_Description Customer_Master Sales_Order Bill_of_Lading Invoice Cash_Receipts Product_Master +
Step by Step Solution
3.41 Rating (154 Votes )
There are 3 Steps involved in it
Summary methods like Sum Count and Average can be used to aggregate sum values in a Pivot Table For numeric value fields you insert in your PivotTable the Sum function is used by default but heres how ... View full answer

Get step-by-step solutions from verified subject matter experts