

Question: Question 1: Calculate the operating cash flows question2 : Calculate the free cash flow Martin Manufacturing Company Income Statement for the Year Ended December 31,
Question 1: Calculate the operating cash flows question2 : Calculate the free cash flow
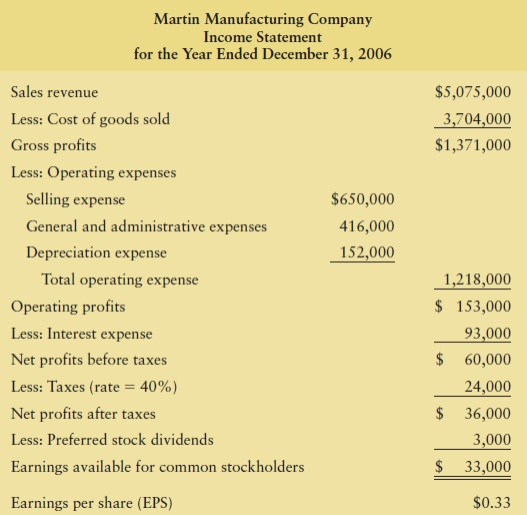
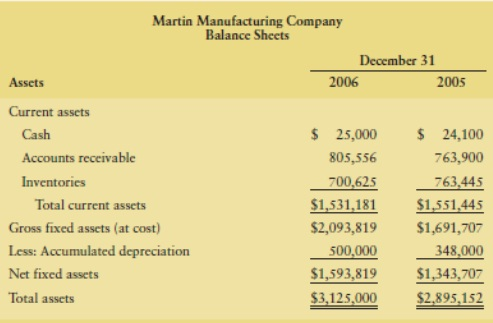
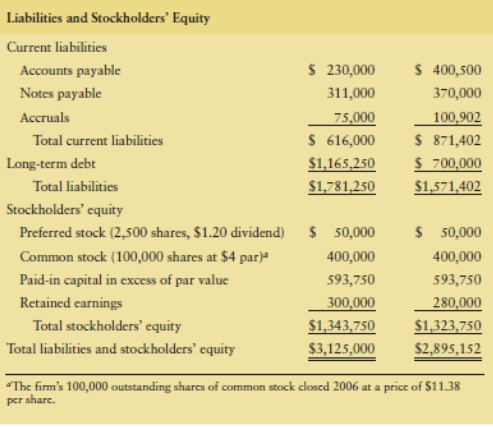
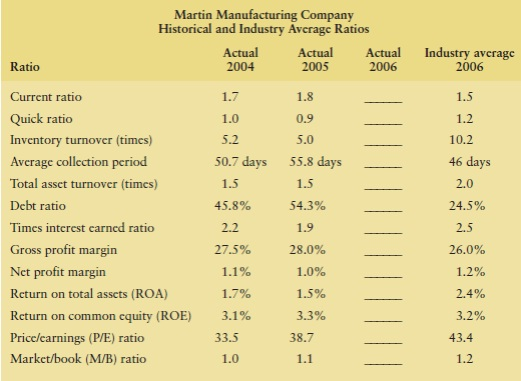
Martin Manufacturing Company Income Statement for the Year Ended December 31, 2006 $5,075,000 3,704,000 $1,371,000 $650,000 416,000 152,000 Sales revenue Less: Cost of goods sold Gross profits Less: Operating expenses Selling expense General and administrative expenses Depreciation expense Total operating expense Operating profits Less: Interest expense Net profits before taxes Less: Taxes (rate = 40%) Net profits after taxes Less: Preferred stock dividends Earnings available for common stockholders 1,218,000 $ 153,000 93,000 $ 60,000 24,000 $ 36,000 3,000 $ 33,000 Earnings per share (EPS) $0.33 Martin Manufacturing Company Balance Sheets December 31 Assets 2006 2005 Current assets Cash $ 25,000 $ 24,100 Accounts receivable 805,556 763,900 Inventories 700,625 763,445 Total current assets $1,531,181 $1,551,445 Gross fixed assets (at cost) $2,093,819 $1,691,707 Less: Accumulated depreciation 500,000 348,000 Net fixed assets $1,593,819 $1,343,707 Total assets $3,125,000 $2,895,152 Liabilities and Stockholders' Equity Current liabilities Accounts payable $ 230,000 $ 400,500 Notes payable 311,000 370,000 Accruals 75,000 100,902 Total current liabilities $ 616,000 $ 871,402 Long-term debt $1,165,250 $ 700,000 Total liabilities $1,781,250 $1,571,402 Stockholders' equity Preferred stock (2,500 shares, $1.20 dividend) $50,000 $ 50,000 Common stock (100,000 shares at $4 par) 400,000 400,000 Paid-in capital in excess of par value 593,750 593,750 Retained earnings 300,000 280,000 Total stockholders' equity $1,343,750 $1,323,750 Total liabilities and stockholders' equity $3,125,000 $2,895,152 The firm's 100,000 cutstanding shares of common stock closed 2006 at a price of $11.38 per share. Martin Manufacturing Company Historical and Industry Average Ratios Actual Actual Actual 2004 2005 2006 Industry average 2006 Ratio 1.7 1.8 1.5 0.9 1.2 1.0 5.2 5.0 10.2 50.7 days 55.8 days 46 days 1.5 1.5 2.0 45.8% 54.3% 24.5% Current ratio Quick ratio Inventory turnover (times) Average collection period Total asset turnover (times) Debt ratio Times interest carned ratio Gross profit margin Net profit margin Return on total assets (ROA) Return on common cquity (ROE) Price/earnings (P/E) ratio Market/book (M/B) ratio 2.2 1.9 2.5 28.0% 26.0% 27.5% 1.1% 1.2% 1.0% 1.5% 1.7% 2.4% 3.1% 3.3% 3.2% 38.7 43.4 33.5 1.0 1.1 1.2
Step by Step Solution
There are 3 Steps involved in it

Get step-by-step solutions from verified subject matter experts