Question: QUESTION 1: Create a flowchart of the entire process with the scenario below. Identify the quality control points requiring constant monitoring. A Restaurant Operation EXAMPLE
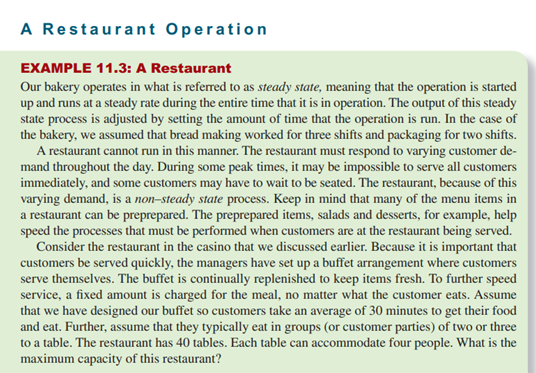
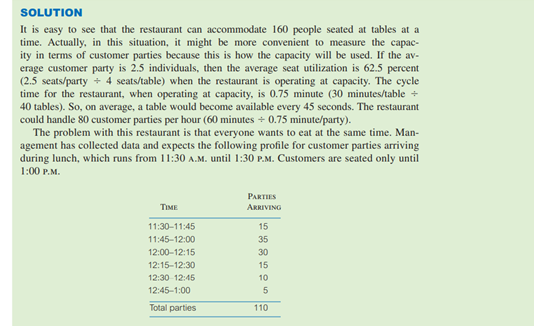
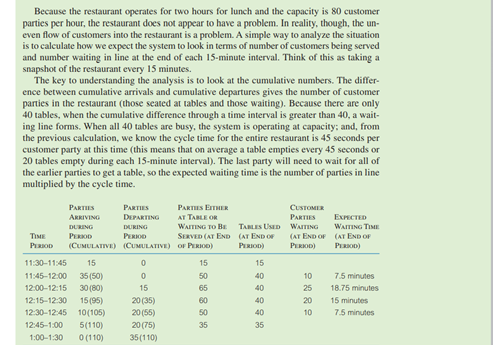
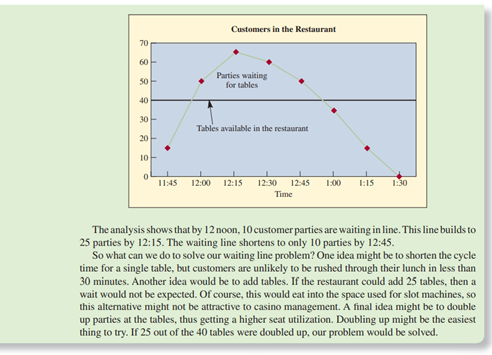
QUESTION 1: Create a flowchart of the entire process with the scenario below. Identify the quality control points requiring constant monitoring. A Restaurant Operation EXAMPLE 11.3: A Restaurant Our bakery operates in what is referred to as steady state, meaning that the operation is started up and runs at a steady rate during the entire time that it is in operation. The output of this steady state process is adjusted by setting the amount of time that the operation is run. In the case of the bakery, we assumed that bread making worked for three shifts and packaging for two shifts. A restaurant cannot run in this manner. The restaurant must respond to varying customer de- mand throughout the day. During some peak times, it may be impossible to serve all customers immediately, and some customers may have to wait to be seated. The restaurant, because of this varying demand, is a non-steady state process. Keep in mind that many of the menu items in a restaurant can be preprepared. The preprepared items, salads and desserts, for example, help speed the processes that must be performed when customers are at the restaurant being served. Consider the restaurant in the casino that we discussed earlier. Because it is important that customers be served quickly, the managers have set up a buffet arrangement where customers serve themselves. The buffet is continually replenished to keep items fresh. To further speed service, a fixed amount is charged for the meal, no matter what the customer eats. Assume that we have designed our buffet so customers take an average of 30 minutes to get their food and eat. Further, assume that they typically eat in groups (or customer parties) of two or three to a table. The restaurant has 40 tables. Each table can accommodate four people. What is the maximum capacity of this restaurant? SOLUTION It is easy to see that the restaurant can accommodate 160 people seated at tables at a time. Actually, in this situation, it might be more convenient to measure the capac- ity in terms of customer parties because this is how the capacity will be used. If the av- erage customer party is 2.5 individuals, then the average seat utilization is 62.5 percent (2.5 seats/party + 4 seats/table) when the restaurant is operating at capacity. The cycle time for the restaurant, when operating at capacity, is 0.75 minute (30 minutes/table- 40 tables). So, on average, a table would become available every 45 seconds. The restaurant could handle 80 customer parties per hour (60 minutes +0.75 minute/party). The problem with this restaurant is that everyone wants to eat at the same time. Man- agement has collected data and expects the following profile for customer parties arriving during lunch, which runs from 11:30 A.M. until 1:30 P.M. Customers are seated only until 1:00 PM TIME PARTIES ARRIVING 11:30-11:45 11:45-12:00 12:00-12:15 12:15-12:30 12:30 12:45 12:45-1:00 Total parties 15 35 30 15 10 5 110 Because the restaurant operates for two hours for lunch and the capacity is 80 customer parties per hour, the restaurant does not appear to have a problem. In reality, though, the un- even flow of customers into the restaurant is a problem. A simple way to analyze the situation is to calculate how we expect the system to look in terms of number of customers being served and number waiting in line at the end of each 15-minute interval. Think of this as taking a snapshot of the restaurant every 15 minutes. The key to understanding the analysis is to look at the cumulative numbers. The differ- ence between cumulative arrivals and cumulative departures gives the number of customer parties in the restaurant (those seated at tables and those waiting). Because there are only 40 tables, when the cumulative difference through a time interval is greater than 40, a wait- ing line forms. When all 40 tables are busy, the system is operating at capacity; and, from the previous calculation, we know the cycle time for the entire restaurant is 45 seconds per customer party at this time this means that on average a table empties every 45 seconds or 20 tables empty during each 15-minute interval). The last party will need to wait for all of the earlier parties to get a table, so the expected waiting time is the number of parties in line multiplied by the cycle time. PARTIES PARTIES PARTIES ETHER CUSTOMER ARRIVINO DEPARTING AT TABLE OR PARTIES EXPECTED DURING DURING WAITING TO BE TABLES USED WAITING WAITING TIME TIME PERIOD PERIOD SERVED (AT END AT END OF (AT END OF (AT END OF PROD (CUMULATIVI) (CUMULATIVE) OF PERIOD) PERIOD) PERIOD) P230) 11:30-11:45 15 0 15 15 11:45-12:00 35(50) 0 50 40 10 7.5 minutes 12:00-12:15 30(80) 15 65 40 25 18.75 minutes 12:15-12:30 15 (95) 20 (35) 60 40 20 15 minutes 12:30-12:45 10(105) 20 (55) 50 40 10 7.5 minutes 12:45-1:00 5(110) 20(75) 35 35 1:00-1:30 0 (110) 35(110) Customers in the Restaurant 70 601 50 Parties waiting for tables 40 30 Tables available in the restaurant 20 10 0 11:45 12:00 12:15 1:00 1:15 1:30 12-30 12345 Time The analysis shows that by 12 noon, 10 customer parties are waiting in line. This line builds to 25 parties by 12:15. The waiting line shortens to only 10 parties by 12:45. So what can we do to solve our waiting line problem? One idea might be to shorten the cycle time for a single table, but customers are unlikely to be rushed through their lunch in less than 30 minutes. Another idea would be to add tables. If the restaurant could add 25 tables, then a wait would not be expected. Of course, this would eat into the space used for slot machines, so this alternative might not be attractive to casino management. A final idea might be to double up parties at the tables, thus getting a higher seat utilization. Doubling up might be the easiest thing to try. If 25 out of the 40 tables were doubled up, our problem would be solved


