

Question: Question 1 Describe the relationship between the data in the scatter plot. 45 40 35 30 25 20 15 10 5 10 15 20 25
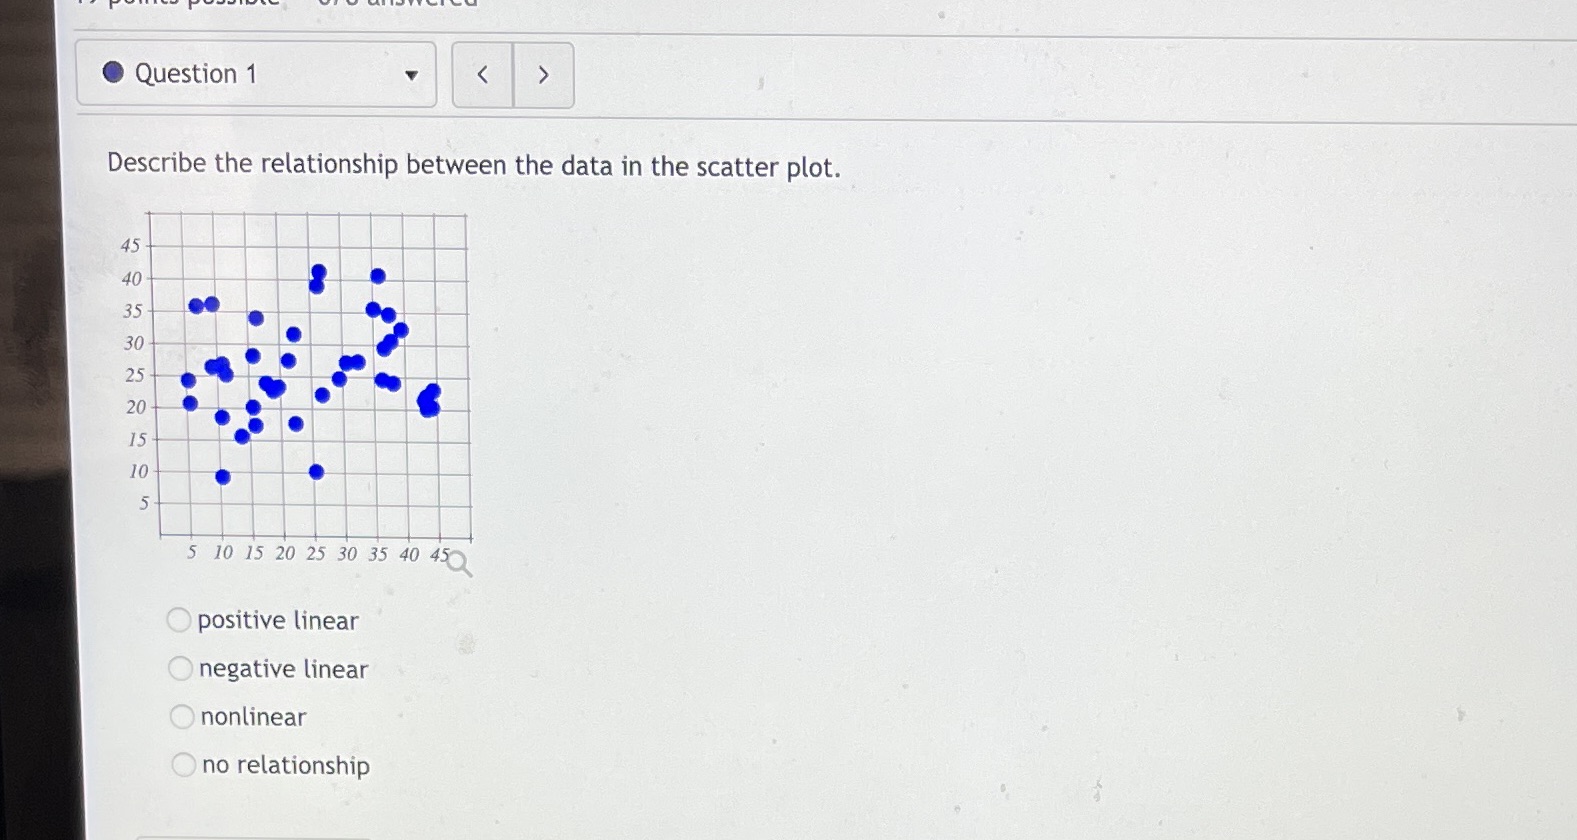
Question 1 Describe the relationship between the data in the scatter plot. 45 40 35 30 25 20 15 10 5 10 15 20 25 30 35 40 45 O positive linear O negative linear nonlinear Ono relationship
Step by Step Solution
There are 3 Steps involved in it
1 Expert Approved Answer
Step: 1 Unlock

Question Has Been Solved by an Expert!
Get step-by-step solutions from verified subject matter experts
Step: 2 Unlock
Step: 3 Unlock