

Question: Question 1 First, the dataset is read and explored using the code below: 1 compost_dataset = read. cav(compost. cav, header=TRUE) dim (Compost_dataset) 3 summary (Compost_dataset
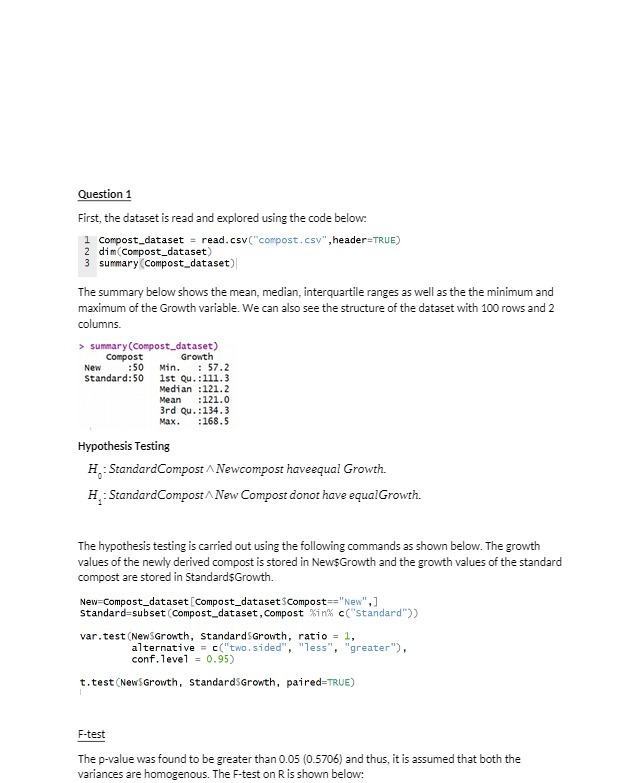
Question 1 First, the dataset is read and explored using the code below: 1 compost_dataset = read. cav("compost. cav", header=TRUE) dim (Compost_dataset) 3 summary (Compost_dataset )| The summary below shows the mean, median, interquartile ranges as well as the the minimum and maximum of the Growth variable. We can also see the structure of the dataset with 100 rows and 2 columns. > summary (Compost_dataset) Compost Growth New :50 Min. : 57.2 Standard: 50 1st Qu. : 111.3 Median : 121.2 Mean :121.0 3rd Qu. :134.3 Max. : 168.5 Hypothesis Testing H. : StandardCompost A Newcompost haveequal Growth. H, : StandardCompost / New Compost donot have equalGrowth. The hypothesis testing is carried out using the following commands as shown below. The growth values of the newly derived compost is stored in NewsGrowth and the growth values of the standard compost are stored in StandardsGrowth. New=Compost_dataset [Compost_dataset $Compost= ="New", ] standard=subset (Compost_dataset, Compost *ink c("standard")) var . test (NewSGrowth, StandardsGrowth, ratio = 1 alternative = c("two. sided", "less", "greater"), conf. level = 0.95) t. test (NewsGrowth, StandardsGrowth, paired=TRUE) F-test The p-value was found to be greater than 0.05 (0.5706) and thus, it is assumed that both the variances are homogenous. The F-test on R is shown below
Step by Step Solution
There are 3 Steps involved in it

Get step-by-step solutions from verified subject matter experts