

Question: Question 1: For the below given data (image), prepare the SPSS file and save it as dataset_LW1 and submit the Sav file along with this
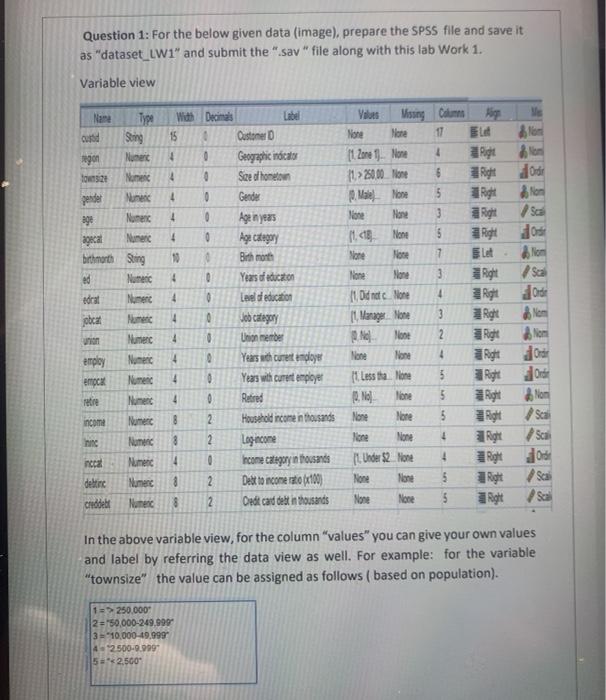
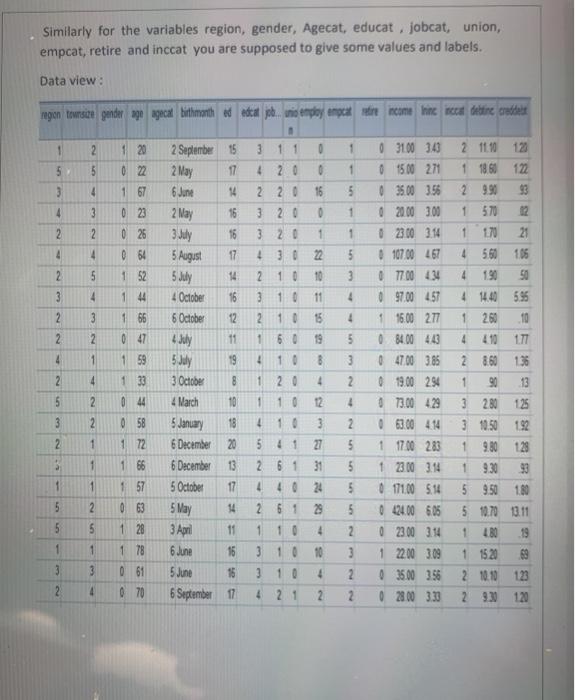
Question 1: For the below given data (image), prepare the SPSS file and save it as "dataset_LW1" and submit the "Sav" file along with this lab Work 1. Variable view Nane Type Sering Nuner With Decimals 15 ngon 4 0 Customer Geographic indicals Seed hometom 2 Ordie Tos24 Nome 4 0 0 4 Gender 4 0 pender Nunen 298 Nomenc Numer bitharth Sting ed 4 0 10 More 4 0 Alion Sa Orde torat 4 0 Vous Missing Columns None More 17 EL (1.2ore 1 More 4 11 > 250.00 More 6 Right Mare Nose 5 More More 3 Right None $ Right Sione 7 let lione None 3 Right 4 11 Od nec. None Right 11. Manage None 3 2 Right None 2 Right None Hone 4 Right 11 Less tha None 5 Right 0, No. line 5 Right None More 5 Right None None 1 Right 1. Under $2_ None 4 None None 5 Right None None 5 Right obcat 4 4 Non Numer Numec Numeric Numec 4 Age Category Birth month Years of education Leidd education Job Category Union member Years with cures endlayer Years with curent employer Retred Household income in thousands Log income Income Category in thousands Debt to income rato (100) Oedit card debt in thousands employ 4 errocx 0 retre Nunc 4 0 Non Sca income Numec 8 2 hinc Nomenc 8 2 4 nccal 0 08 detine Numec 2 2 Chodelt None 2 In the above variable view, for the column "values" you can give your own values and label by referring the data view as well. For example: for the variable "townsize" the value can be assigned as follows (based on population). 1 => 250.000 2 = '50,000-249.999 3=10,000-49,999 4 2.500.0.999 5*2.500 Similarly for the variables region, gender, Agecat, educat, jobcat, union, empcat, retire and inccat you are supposed to give some values and labels. Data view : ngon Townsite gender age agecat bithmonth decat job. tnio employ neck are income the nece detine credider 1 2 120 3 11 0 5 022 5 3 1 5 4 1 67 4 3 1 4 20 0 220 16 3 20 0 3 20 1 4 3022 2 10 10 2 023 0 26 0 64 2 1 2 11.10 123 1 1860 122 2 990 93 1 570 12 1 170 21 4 560 105 4 50 4 14.40 595 2.60 10 4 177 4 4 5 3 2 5 1 52 1 44 3 4 3 10 11 4 2 3 1 66 4 2 10 1 60 15 9 2 0 47 4 1 4 8 2 860 136 1 59 1 33 2 September 15 2 May 17 6 June 14 2 May 16 3 July 16 5 August 17 5 July 14 4 October 16 6 October 4 July 11 5 July 19 3 October 8 4 March 10 5 January 18 6 December 20 6 December 13 5 October 17 5 May 14 3 April 11 6 June 16 5 June 16 6 September 11 10 20 5 3 2 4 3100 3.4 0 1500 271 0 3500 356 0 2000 3.00 0 23.00 3.14 107.00 467 0 77.00 434 0 97.00 457 1 16.00 277 0 84.00 4.0 0 47.00 385 0 19.00 294 13.00 429 0 63.00 414 1 17.00 283 1 23.00 3.14 171.00 5.14 0 24.00 605 0 2300 314 1 22.00 3.09 0 3500 358 0 2800 333 2 4 1 4 5 2 044 1 10 12 3 2 1 4 10 541 2 61 4 40 3 27 31 2. 5 5 5 + a 1 0 58 1 72 1 66 1 57 0 63 1 28 1 78 1 1 24 3 280 125 3 1050 192 1 9.80 128 9.30 5 950 1.80 5 10.70 13.11 1.80 19 1 1520 2 10.10 123 29.3120 5 2 2 61 29 5 1 10 4 1 10 1 3 2 3 3 10 4 5 2 3 2 2 3 0 61 4 0 70 4 21 2 Question 2: Using "dataset_LW1.sav" find the following: Mean, median, Quartiles, range, maximum, minimum, variance, standard deviation and outliers for the variable "income". NOTE: first write the SPSS Commands (example: Analyze Descriptive Statistics Frequencies Statistics ?) then copy and paste necessary part of the output file here. Answer: Probability & Statistics-Lab-SPSS, MATH 312, Semester 422, Version Page 4 of 6 Question 3: Using "dataset_LW1.sav" (1) Generate Bar chart for "Jobcat" (ii) Generate Pie chart for "ed" (IM) Generate Histogram for "region" (iv) Generate Stem and leaf for "Age" NOTE: first write the SPSS Commands, then copy and paste necessary part of the output file here. Answer: Probability & Statistics Lab SPSS MATH 312. Secter 422. Version Page 5 of 6 Question 4: Using "dataset_LW1.sav" (1) Generate Cross tabulation between "educat" and "income" (write SPSS Commands, copy and paste the "output file" (ii) Use "visual binning" to bin the variable "ed" (write SPSS Commands and paste here the screenshot of the binned variable column") (iii) "sort variable" by "name" in ascending order and paste here the screen shot.( also write SPSS commands) Question 1: For the below given data (image), prepare the SPSS file and save it as "dataset_LW1" and submit the "Sav" file along with this lab Work 1. Variable view Nane Type Sering Nuner With Decimals 15 ngon 4 0 Customer Geographic indicals Seed hometom 2 Ordie Tos24 Nome 4 0 0 4 Gender 4 0 pender Nunen 298 Nomenc Numer bitharth Sting ed 4 0 10 More 4 0 Alion Sa Orde torat 4 0 Vous Missing Columns None More 17 EL (1.2ore 1 More 4 11 > 250.00 More 6 Right Mare Nose 5 More More 3 Right None $ Right Sione 7 let lione None 3 Right 4 11 Od nec. None Right 11. Manage None 3 2 Right None 2 Right None Hone 4 Right 11 Less tha None 5 Right 0, No. line 5 Right None More 5 Right None None 1 Right 1. Under $2_ None 4 None None 5 Right None None 5 Right obcat 4 4 Non Numer Numec Numeric Numec 4 Age Category Birth month Years of education Leidd education Job Category Union member Years with cures endlayer Years with curent employer Retred Household income in thousands Log income Income Category in thousands Debt to income rato (100) Oedit card debt in thousands employ 4 errocx 0 retre Nunc 4 0 Non Sca income Numec 8 2 hinc Nomenc 8 2 4 nccal 0 08 detine Numec 2 2 Chodelt None 2 In the above variable view, for the column "values" you can give your own values and label by referring the data view as well. For example: for the variable "townsize" the value can be assigned as follows (based on population). 1 => 250.000 2 = '50,000-249.999 3=10,000-49,999 4 2.500.0.999 5*2.500 Similarly for the variables region, gender, Agecat, educat, jobcat, union, empcat, retire and inccat you are supposed to give some values and labels. Data view : ngon Townsite gender age agecat bithmonth decat job. tnio employ neck are income the nece detine credider 1 2 120 3 11 0 5 022 5 3 1 5 4 1 67 4 3 1 4 20 0 220 16 3 20 0 3 20 1 4 3022 2 10 10 2 023 0 26 0 64 2 1 2 11.10 123 1 1860 122 2 990 93 1 570 12 1 170 21 4 560 105 4 50 4 14.40 595 2.60 10 4 177 4 4 5 3 2 5 1 52 1 44 3 4 3 10 11 4 2 3 1 66 4 2 10 1 60 15 9 2 0 47 4 1 4 8 2 860 136 1 59 1 33 2 September 15 2 May 17 6 June 14 2 May 16 3 July 16 5 August 17 5 July 14 4 October 16 6 October 4 July 11 5 July 19 3 October 8 4 March 10 5 January 18 6 December 20 6 December 13 5 October 17 5 May 14 3 April 11 6 June 16 5 June 16 6 September 11 10 20 5 3 2 4 3100 3.4 0 1500 271 0 3500 356 0 2000 3.00 0 23.00 3.14 107.00 467 0 77.00 434 0 97.00 457 1 16.00 277 0 84.00 4.0 0 47.00 385 0 19.00 294 13.00 429 0 63.00 414 1 17.00 283 1 23.00 3.14 171.00 5.14 0 24.00 605 0 2300 314 1 22.00 3.09 0 3500 358 0 2800 333 2 4 1 4 5 2 044 1 10 12 3 2 1 4 10 541 2 61 4 40 3 27 31 2. 5 5 5 + a 1 0 58 1 72 1 66 1 57 0 63 1 28 1 78 1 1 24 3 280 125 3 1050 192 1 9.80 128 9.30 5 950 1.80 5 10.70 13.11 1.80 19 1 1520 2 10.10 123 29.3120 5 2 2 61 29 5 1 10 4 1 10 1 3 2 3 3 10 4 5 2 3 2 2 3 0 61 4 0 70 4 21 2 Question 2: Using "dataset_LW1.sav" find the following: Mean, median, Quartiles, range, maximum, minimum, variance, standard deviation and outliers for the variable "income". NOTE: first write the SPSS Commands (example: Analyze Descriptive Statistics Frequencies Statistics ?) then copy and paste necessary part of the output file here. Answer: Probability & Statistics-Lab-SPSS, MATH 312, Semester 422, Version Page 4 of 6 Question 3: Using "dataset_LW1.sav" (1) Generate Bar chart for "Jobcat" (ii) Generate Pie chart for "ed" (IM) Generate Histogram for "region" (iv) Generate Stem and leaf for "Age" NOTE: first write the SPSS Commands, then copy and paste necessary part of the output file here. Answer: Probability & Statistics Lab SPSS MATH 312. Secter 422. Version Page 5 of 6 Question 4: Using "dataset_LW1.sav" (1) Generate Cross tabulation between "educat" and "income" (write SPSS Commands, copy and paste the "output file" (ii) Use "visual binning" to bin the variable "ed" (write SPSS Commands and paste here the screenshot of the binned variable column") (iii) "sort variable" by "name" in ascending order and paste here the screen shot.( also write SPSS commands)
Step by Step Solution
There are 3 Steps involved in it

Get step-by-step solutions from verified subject matter experts