

Question: Question 1 Given the forecast Data Given, Calculate the MAD ( mean absolute deviation ) for 2 0 1 9 using a three month moving
Question
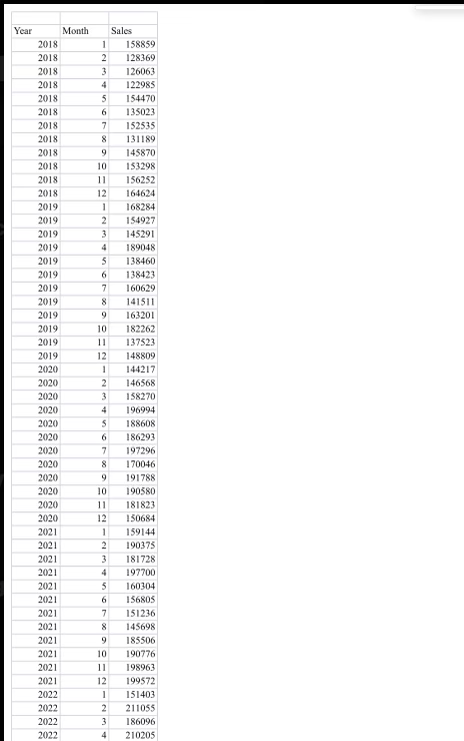
Given the forecast Data Given, Calculate the MAD mean absolute deviation for using a three month moving average.
Question
Given the Forecast Data and your forecast using a three month moving average, what is the tracking signal for remember that the tracking signal is sum of errors MAD
Question
Given the forecast Data Given, Calculate the MAD mean absolute deviation for using a three month moving average.
Question
Given the Forecast Data and your forecast using a three month moving average, what is the tracking signal for remember that the tracking signal is sum of errors MAD
Question
Given the forecast Data Given, Calculate the MAD mean absolute deviation for using a three month moving average.
Question
Given the Forecast Data and your forecast using a three month moving average, what is the tracking signal for remember that the tracking signal is sum of errors MAD
Question
Given the sales data for the spinners, graph this in Excel.Use a line Which possible aspect of the data is most prominent?
Trend
Randomness
Seasonality
Cyclicality
Step by Step Solution
There are 3 Steps involved in it
1 Expert Approved Answer
Step: 1 Unlock

Question Has Been Solved by an Expert!
Get step-by-step solutions from verified subject matter experts
Step: 2 Unlock
Step: 3 Unlock