

Question: Question 1: Graphing and analysis (8 Marks) Notes: For parts a) and b) of this question, you are to draw on a graph paper.
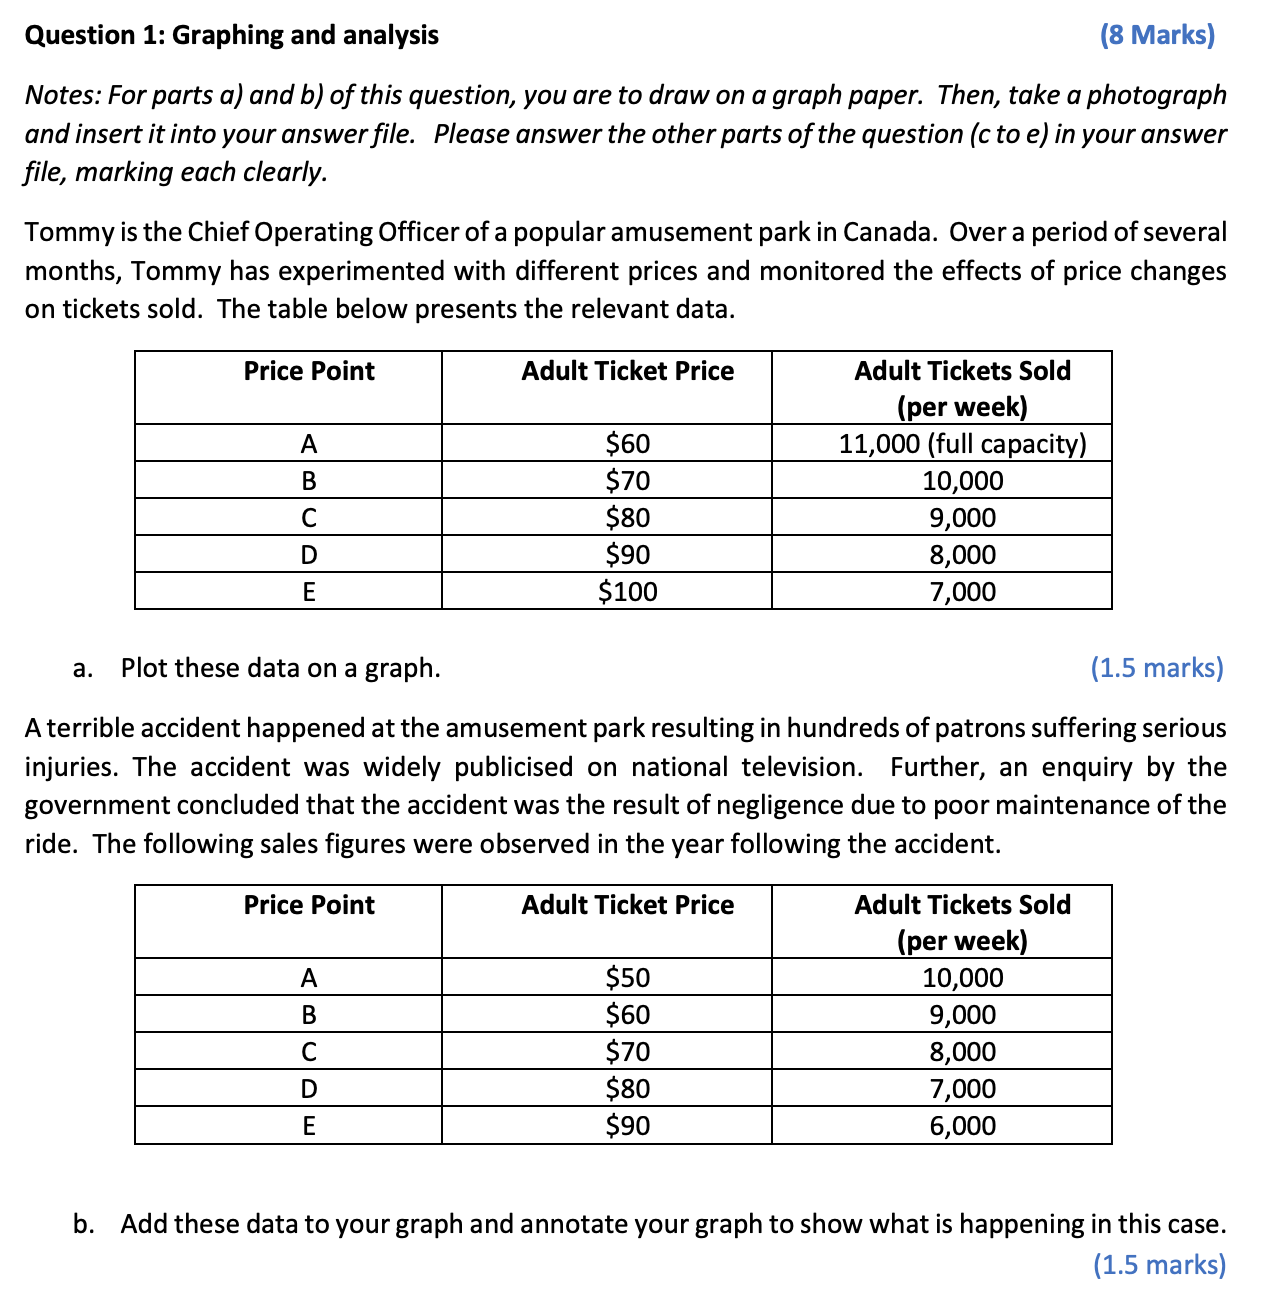
Question 1: Graphing and analysis (8 Marks) Notes: For parts a) and b) of this question, you are to draw on a graph paper. Then, take a photograph and insert it into your answer file. Please answer the other parts of the question (c to e) in your answer file, marking each clearly. Tommy is the Chief Operating Officer of a popular amusement park in Canada. Over a period of several months, Tommy has experimented with different prices and monitored the effects of price changes on tickets sold. The table below presents the relevant data. Adult Ticket Price Price Point a. A B D E $60 $70 $80 $90 $100 A B C D E Plot these data on a graph. (1.5 marks) A terrible accident happened at the amusement park resulting in hundreds of patrons suffering serious injuries. The accident was widely publicised on national television. Further, an enquiry by the government concluded that the accident was the result of negligence due to poor maintenance of the ride. The following sales figures were observed in the year following the accident. Price Point Adult Ticket Price Adult Tickets Sold (per week) $50 $60 $70 $80 $90 11,000 (full capacity) 10,000 9,000 8,000 7,000 Adult Tickets Sold (per week) 10,000 9,000 8,000 7,000 6,000 b. Add these data to your graph and annotate your graph to show what is happening in this case. (1.5 marks)
Step by Step Solution
3.42 Rating (152 Votes )
There are 3 Steps involved in it
Question 1 Graphing and analysis a Plotting data on a graph Price Point Adult Ticket Price Adult Tic... View full answer

Get step-by-step solutions from verified subject matter experts