

Question: Question 1 : HW 3 . xls is provided in the uploaded media folder under files in canvas. This is data for one subdivision of
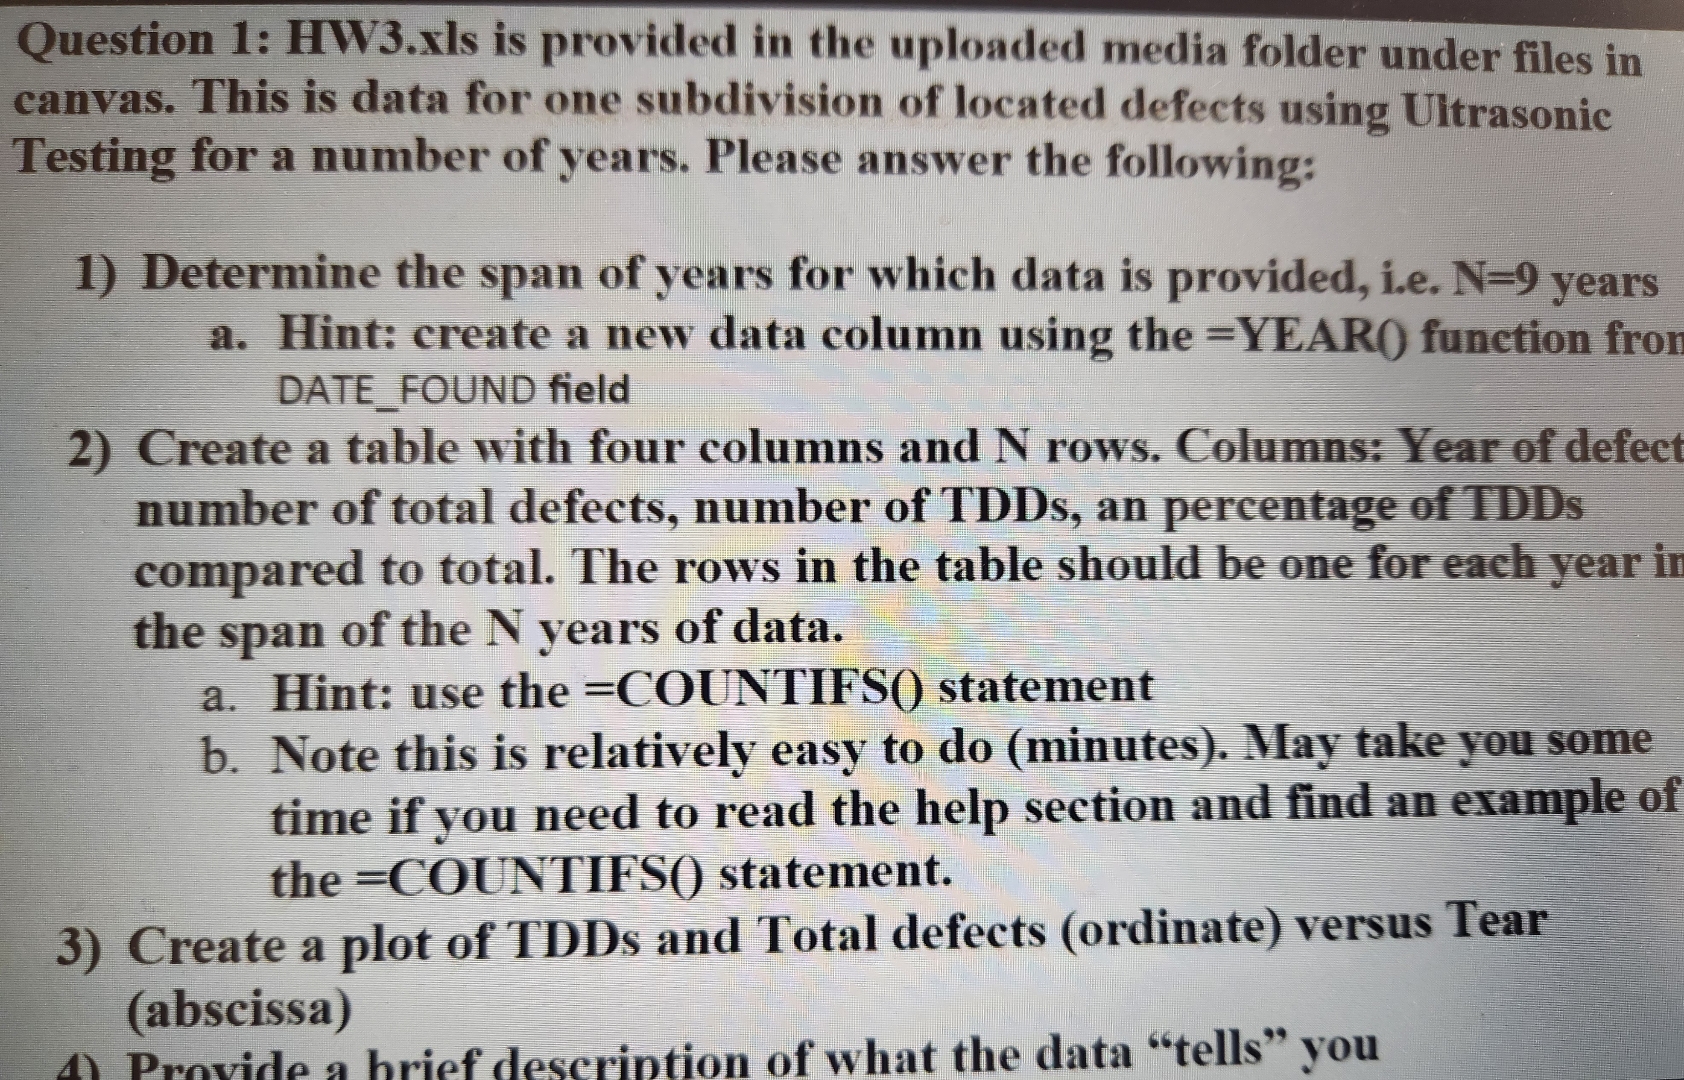
Question : HWxls is provided in the uploaded media folder under files in canvas. This is data for one subdivision of located defects using Ultrasonic Testing for a number of years. Please answer the following:
Determine the span of years for which data is provided, ie years
a Hint: create a new data column using the YEAR function fron DATEFOUND field
Create a table with four columns and N rows. Columns: Year of defect number of total defects, number of TDDs an percentage of TDDs compared to total. The rows in the table should be one for each year in the span of the years of data.
a Hint: use the COUNTIFS statement
b Note this is relatively easy to do minutes May take you some time if you need to read the help section and find an example of the COUNTIFS statement.
Create a plot of TDDs and Total defects ordinate versus Tear abscissa
Step by Step Solution
There are 3 Steps involved in it
1 Expert Approved Answer
Step: 1 Unlock

Question Has Been Solved by an Expert!
Get step-by-step solutions from verified subject matter experts
Step: 2 Unlock
Step: 3 Unlock