

Question: Question 1 In the most recent reporting period, how much profit did Nike eam after recognizing the cost of inventory sold? Oa. $44,538 Ob. $19,962
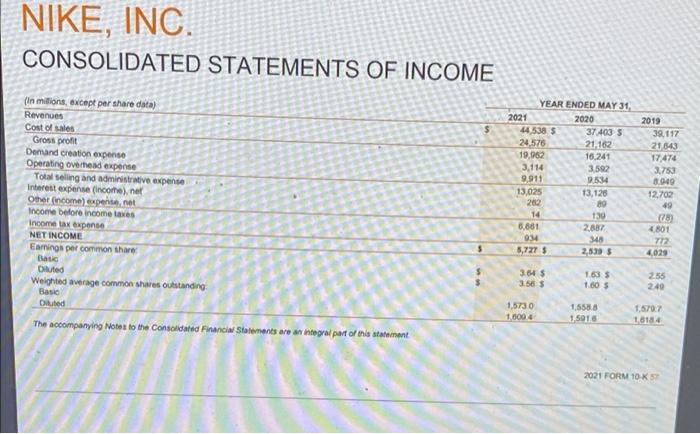
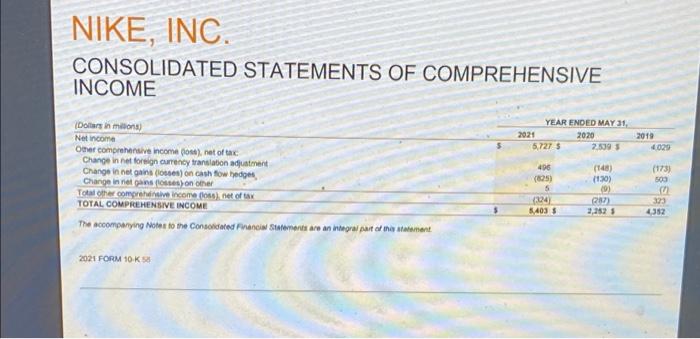
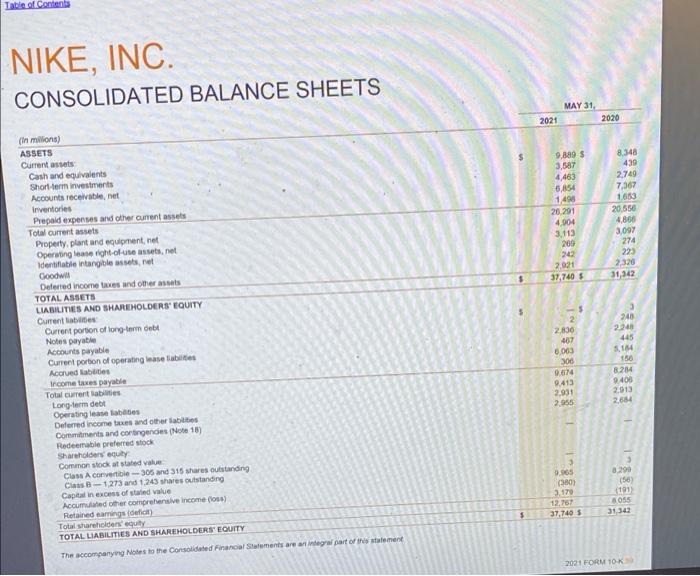
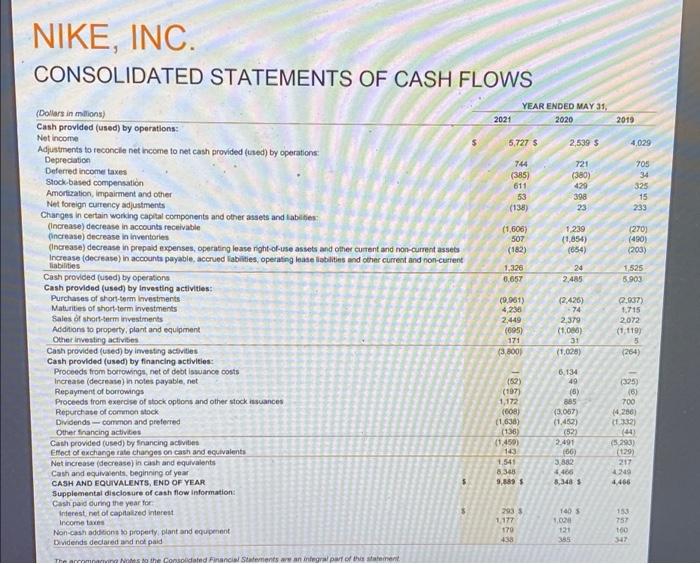
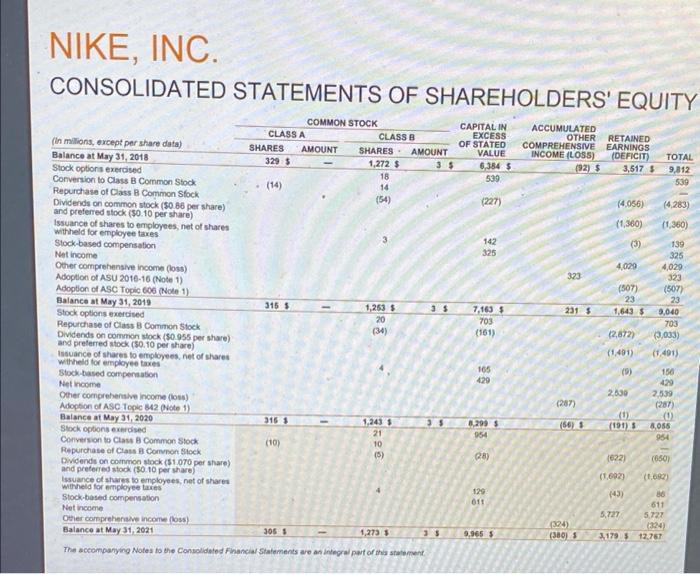
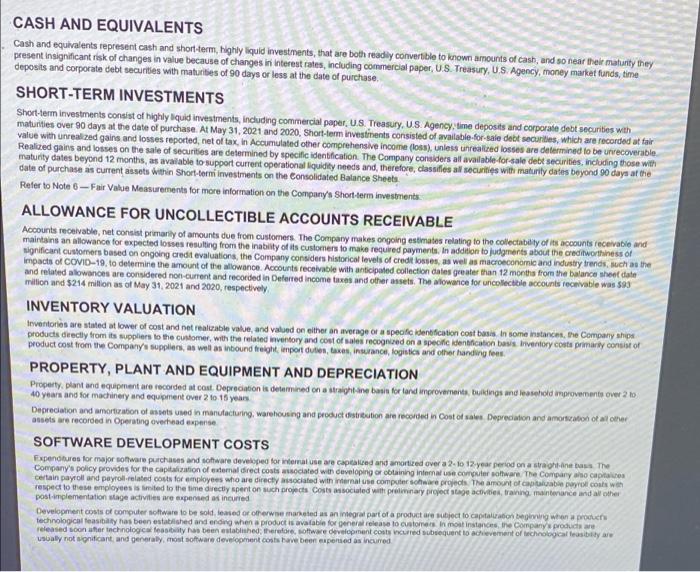
Question 1 In the most recent reporting period, how much profit did Nike eam after recognizing the cost of inventory sold? Oa. $44,538 Ob. $19,962 Oc. $5,727 Od. $6,661. NIKE, INC. CONSOLIDATED STATEMENTS OF INCOME (In milions, except per share data) 2021 Revenues $ Cost of sales Gross profit Demand creation expense Operating overhead expense Total selling and administrative expense Interest expense (income), net Other (income) expense, net Income before income taxes Income tax expense NET INCOME Earnings per common share Basic Diluted Weighted average common shares outstanding Basic Diluted The accompanying Notes to the Consolidated Financial Statements are an integral part of this statement S YEAR ENDED MAY 31, 2020 37.403 S 21.162 16,241 3,592 9.534 13,126 89 130 2,887 348 2,539 S 1.63 $ 1.60 1,558.8 1,5916 44,538 S 24,576 19,962 3,114 9.911 13,025 282 14 6.661 934 5,727 S 3.64 $ 3.56 $ 1,5730 1,000.4 2019 39,117 21,643 17,474 3,753 8.049 12,702 49 (178) 4.801 772 4,029 2.55 2.49 1,5707 1.6184 2021 FORM 10-K 5 NIKE, INC. CONSOLIDATED STATEMENTS OF COMPREHENSIVE INCOME YEAR ENDED MAY 31, (Dollars in millions) 2021 2020 Net income 2.539 S Other comprehensive income (loss), net of tax Change in net foreign currency translation adjustment Change in net gains (losses) on cash flow hedges, (148) (130) Change in net gains (losses) on other (9) Total other comprehensive income (oss), net of tax (287) TOTAL COMPREHENSIVE INCOME 2,252 S The accompanying Notes to the Consolidated Financial Statements are an integral part of this statement 2021 FORM 10-K 58 5,727 S 496 (825) 5 (324) 5,403 S 2019 4.029 (173) 503 S 323 4,352 Table of Contents NIKE, INC. CONSOLIDATED BALANCE SHEETS (in millions) ASSETS Current assets Cash and equivalents Short-term investments Accounts receivable, net Inventories Prepaid expenses and other current assets Total current assets Property, plant and equipment, net Operating lease right-of-use assets, net Identifiable intangible assets, net Goodwill Deferred income taxes and other assets TOTAL ASSETS LIABILITIES AND SHAREHOLDERS' EQUITY Current liabilities Current portion of long-term debt Notes payable Accounts payable Current portion of operating lease liabilities Accrued abilities Income taxes payable Total current Sabilities Long-term debt Operating lease labides Deferred income taxes and other labilities Commitments and contingencies (Note 18) Redeemable preferred stock Shareholders equity Common stock at stated value Class A convertible-305 and 315 shares outstanding Class B 1,273 and 1,243 shares outstanding Capital in excess of stated value Accumulated other comprehensive income (los) Retained eamings (deficit) Total shareholders' equity TOTAL LIABILITIES AND SHAREHOLDERS' EQUITY The accompanying Notes to the Consolidated Financial Statements are an integral part of this statement $ 2021 MAY 31, 9.889 S 3,587 4,463 6,854 1,496 26,291 4,904 3,113 269 242 2.921 37,740 2 2,836 467 6,063 306 9.674 9.413 2.931 2,955 9,965 (380) 3.179 12,767 37,740 S 2020 8.348 439 2,749 7,367 1.653 20.550 4,860 3,097 274 223 2,326 31,342 3 240 2.248 445 5,164 156 8.284 9.408 2013 2,684 8.299 (56) (191) 6055 31,342 2021 FORM 10-K NIKE, INC. CONSOLIDATED STATEMENTS OF CASH FLOWS (Dollars in millions) 2021 Cash provided (used) by operations: Net income Adjustments to reconcile net income to net cash provided (used) by operations: Depreciation Deferred income taxes Stock-based compensation Amortization, impairment and other Net foreign currency adjustments Changes in certain working capital components and other assets and liabilities: (Increase) decrease in accounts receivable (increase) decrease in inventories (Increase) decrease in prepaid expenses, operating lease right-of-use assets and other current and non-current assets Increase (decrease) in accounts payable, accrued liabilities, operating lease liabilities and other current and non-current liabilities Cash provided (used) by operations Cash provided (used) by Investing activities: Purchases of short-term investments Maturities of short-term investments Sales of short-term investments Additions to property, plant and equipment Other investing activites Cash provided (used) by investing activities Cash provided (used) by financing activities: Proceeds from borrowings, net of debt issuance costs Increase (decrease) in notes payable, net Repayment of borrowings Proceeds from exercise of stock options and other stock issuances Repurchase of common stock Dividends-common and preferred Other financing activities Cash provided (used) by financing activities Effect of exchange rate changes on cash and equivalents Net increase (decrease) in cash and equivalents Cash and equivalents, beginning of year CASH AND EQUIVALENTS, END OF YEAR Supplemental disclosure of cash flow information: Cash paid during the year for Interest, net of capitalized interest Income taxes Non-cash additions to property, plant and equipement Dividends declared and not paid The aromanina Notes to the Consolidated Financial Statements are an integral part of this statement $ $ 5,727 S 744 (385) 611 53 (138) YEAR ENDED MAY 31, 2020 2,539 $ 721 (380) 429 398 23 1,239 (1,854) (654) 24 2,485 (2,426) -74 2,379 (1,066) 31 (1,028) 6,134 49 (6) (1,606) 507 (182) 1,326 6.657 (9.961) 4,236 2,449 (695) 171 (3,800) (52) (197) 1,172 (608) (1,638) (136) (1450) 143 1,541 8,348 9.889 293 $ 1,177 170 438 885 (3.067) (1,452) (52) 2.491 3,882 4,466 8,348 (66) 140 S 1,028 121 385 2019 4,029 705 34 325 15 233 (270) (490) (203) 1,525 5,903 (2.937) 1,715 2,072 (1,119) 5 (264) (325) (6) 700 (4,286) (1.332) (44) (5,293) (129) 217 4249 4,466 153 757 160 347 NIKE, INC. CONSOLIDATED STATEMENTS OF SHAREHOLDERS' EQUITY COMMON STOCK CAPITAL IN CLASS A CLASS B EXCESS RETAINED OF STATED ACCUMULATED OTHER COMPREHENSIVE EARNINGS INCOME (LOSS) SHARES AMOUNT SHARES AMOUNT VALUE (in millions, except per share data) Balance at May 31, 2018 Stock options exercised (DEFICIT) TOTAL 3,517 S 9,812 1,272 $ 3 $ 6,384 (92) $ 18 539 539 14 Conversion to Class B Common Stock Repurchase of Class B Common Stock Dividends on common stock ($0.86 per share) and preferred stock ($0.10 per share) (54) (227) (4,056) (4,283) (1,360) (1,360) Issuance of shares to employees, net of shares withheld for employee taxes 142 (3) 139 Stock-based compensation 325 325 Net income Other comprehensive income (loss) Adoption of ASU 2016-16 (Note 1) Adoption of ASC Topic 606 (Note 1) Balance at May 31, 2019 1,253 $ Stock options exercised 20 7,163 $ 703 (161) (34) Repurchase of Class B Common Stock Dividends on common stock ($0.955 per share) and preferred stock ($0.10 per share) Issuance of shares to employees, net of shares withheld for employee taxes 165 429 Stock-based compensation Net income Other comprehensive income (loss) Adoption of ASC Topic 842 (Note 1) Balance at May 31, 2020 315 $ 1,243 8,299 Stock options exercised 21 954 Conversion to Class B Common Stock (10) 10 Repurchase of Class B Common Stock (28) Dividends on common stock ($1.070 per share) and preferred stock (50.10 per share) Issuance of shares to employees, net of shares withheld for employee taxes Stock-based compensation Net income Other comprehensive income (loss) Balance at May 31, 2021 305 1,273 35 The accompanying Notes to the Consolidated Financial Statements are an integral part of this statement 329 S (14) 315 S (5) 3 $ 35 129 011 9,965 $ 323 231 S (287) (56) (324) (380) 4,029 (507) 23 1,643 $ 4,029 323 (507) 23 9,040 703 (3,033) (1.491) 150 429 2,539 (287) (1) 6,055 954 (650) (1,692) 86 611 5,727 5,727 (324) 3,179 $ 12,767 (2,872) (1,491) (9) 2,530 (1) (191) (622) (1,692) (43) CASH AND EQUIVALENTS Cash and equivalents represent cash and short-term, highly liquid investments, that are both readily convertible to known amounts of cash, and so near their maturity they present insignificant risk of changes in value because of changes in interest rates, including commercial paper, U.S. Treasury, U.S. Agency, money market funds, time deposits and corporate debt securities with maturities of 90 days or less at the date of purchase. SHORT-TERM INVESTMENTS Short-term investments consist of highly liquid investments, including commercial paper, U.S. Treasury. U.S. Agency, time deposits and corporate debt securities with maturities over 90 days at the date of purchase. At May 31, 2021 and 2020, Short-term investments consisted of available-for-sale debt securities, which are recorded at fair value with unrealized gains and losses reported, net of tax, in Accumulated other comprehensive income (loss), unless unrealized losses are determined to be unrecoverable Realized gains and losses on the sale of securities are determined by specific identification. The Company considers all available-for-sale debt securities, including those with maturity dates beyond 12 months, as available to support current operational liquidity needs and, therefore, classifies all securities with maturity dates beyond 90 days at the date of purchase as current assets within Short-termi investments on the Consolidated Balance Sheets Refer to Note 6-Fair Value Measurements for more information on the Company's Short-term investments ALLOWANCE FOR UNCOLLECTIBLE ACCOUNTS RECEIVABLE Accounts receivable, net consist primarily of amounts due from customers. The Company makes ongoing estimates relating to the collectability of its accounts receivable and maintains an allowance for expected losses resulting from the inability of its customers to make required payments. In addition to judgments about the creditworthiness of significant customers based on ongoing credit evaluations, the Company considers historical levels of credit losses, as well as macroeconomic and industry trends, such as the impacts of COVID-19, to determine the amount of the allowance. Accounts receivable with anticipated collection dates greater than 12 months from the balance sheet date and related allowances are considered non-current and recorded in Deferred income taxes and other assets. The allowance for uncollectible accounts receivable was $93 million and $214 million as of May 31, 2021 and 2020, respectively INVENTORY VALUATION Inventories are stated at lower of cost and net realizable value, and valued on either an average or a specific identification cost basis. In some instances, the Company ships products directly from its suppliers to the customer, with the related inventory and cost of sales recognized on a specific identification basis Inventory costs primarily consist of product cost from the Company's suppliers, as well as inbound freight, import duties, taxes, insurance, logistics and other handling fees PROPERTY, PLANT AND EQUIPMENT AND DEPRECIATION Property, plant and equipment are recorded at cast. Depreciation is determined on a straight-ane basis for land improvements, buildings and leasehold improvements over 2 to 40 years and for machinery and equipment over 2 to 15 years Depreciation and amortization of assets used in manufacturing, warehousing and product distribution are recorded in Cost of sales Depreciation and amortization of all other assets are recorded in Operating overhead expense SOFTWARE DEVELOPMENT COSTS Expenditures for major software purchases and software developed for internal use are capitalized and amortized over a 2-10 12-year period on a straight-ine basis. The Company's policy provides for the capitalization of external direct costs associated with developing or obtaining internal use computer software. The Company also capitalizes certain payroll and payroll-related costs for employees who are directly associated with internal use computer software projects. The amount of capitaluable payroll costs with respect to these employees is limited to the time directly spent on such projects Costs associated with preliminary project stage activities, training, maintenance and all other post-implementation stage activities are expensed as incurred Development costs of computer software to be sold, leased or otherwise marketed as an integral part of a product are subject to capitalization beginning when a products technological feasibility has been established and ending when a product is available for general release to customers. In most instances, the Company's products are released soon after technological feasibility has been established, therefore, software development costs incurred subsequent to achievement of technological feasibility are usually not significant, and generally, most software development costs have been expensed as incurred payments, which are based on a percent of retail sales over specified levels or adjust periodically for inflation as a result of changes in a published index, primarily the Consumer Price Index, and are expensed as incurred. FAIR VALUE MEASUREMENTS The Company measures certain financial assets and liabilities at fair value on a recurring basis, including derivatives, equity securities and available-for-sale debt securities. Fair value is the price the Company would receive to sell an asset or pay to transfer a liability in an orderly transaction with a market participant at the measurement date. The Company uses a three-level hierarchy established by the Financial Accounting Standards Board (FASB) that prioritizes fair value measurements based on the types of inputs used for the various valuation techniques (market approach, income approach and cost approach) The levels of the fair value hierarchy are described below: Level 1: Quoted prices in active markets for identical assets or liabilities Level 2: Inputs other than quoted prices that are observable for the asset or liability, either directly or indirectly, these include quoted prices for similar assets or liabilities in active markets and quoted prices for identical or similar assets or liabilities in markets that are not active Level 3: Unobservable inputs with little or no market data available, which require the reporting entity to develop its own assumptions. The Company's assessment of the significance of a particular input to the fair value measurement in its entirety requires judgment and considers factors specific to the asset or Bability. Financial assets and liabilities are classified in their entirety based on the most conservative level of input that is significant to the fair value measurement Pricing vendors are utilized for a majority of Level 1 and Level 2 investments. These vendors either provide a quoted market price in an active market or use observable inputs without applying significant adjustments in their pricing. Observable inputs include broker quotes, interest rates and yield curves observable at commonly quoted intervals, volatilities and credit risks. The fair value of derivative contracts is determined using observable market inputs such as the daily market foreign currency rates, forward pricing curves, currency volatilities, currency correlations and interest rates and considers nonperformance risk of the Company and its counterparties. The Company's fair value measurement process includes comparing fair values to another independent pricing vendor to ensure appropriate fair values are recorded. Refer to Note 6-Fair Value Measurements for additional information FOREIGN CURRENCY TRANSLATION AND FOREIGN CURRENCY TRANSACTIONS Adjustments resulting from translating foreign functional currency financial statements into U.S. Dollars are included in the foreign currency translation adjustment, a component of Accumulated other comprehensive income (loss) in Total shareholders equity The Company's global subsidiaries have various monetary assets and liabilities, primarily receivables and payables, which are denominated in currencies other than their functional currency. These balance sheet items are subject to remeasurement, the impact of which is recorded in Other (income) expense, net within the Consolidated Statements of income. ACCOUNTING FOR DERIVATIVES AND HEDGING ACTIVITIES The Company uses derivative financial instruments to reduce its exposure to changes in foreign currency exchange rates and interest rates All derivatives are recorded at fair value on the Consolidated Balance Sheets and changes in the fair value of denivative financial instruments are either recognized in Accumulated other comprehensive income (loss) (a component of Total shareholders' equity). Long-term debt or Net income depending on the nature of the underlying exposure, whether the derivative is formally designated as a hedge and, if designated, the extent to which the hedge is effective. The Company classifies the cash flows at settement from derivatives in the same category as the cash flows from the related hedged tems For undesignated hedges and designated cash flow hedges, this is primarily within the Cash provided by operations component of the Consolidated Statements of Cash Flows. For designated net investment bedges, this is within the Cash used by investing activities component of the Consolidated Statements of Cash Flows. For the Company's fair value bedges, which are interest rate swaps used to mitigate the change in fair value of its fixed-rate debt attributable to changes in interest rates, the related cash flows from periodic interest payments are reflected within the Cash provided by operations component of the Consolidated Statements of Cash Flows. Refer to Note 14--Risk Management and Derivatives for additional information on the Company's risk management program and derivatives 2021 FORM 10-KE
Step by Step Solution
There are 3 Steps involved in it

Get step-by-step solutions from verified subject matter experts