

Question: Moving to another question will save this response. estion 16 How much did Nike's revenues and gains exceed its expenses and losses during the most
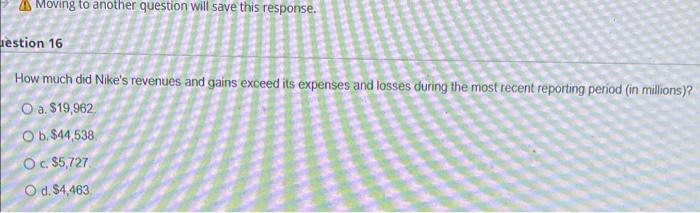
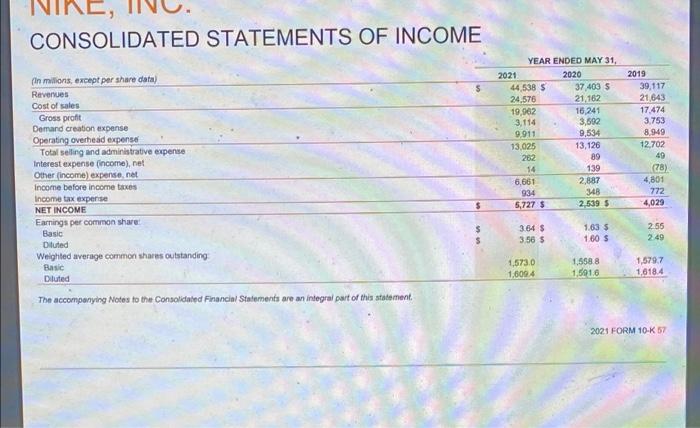
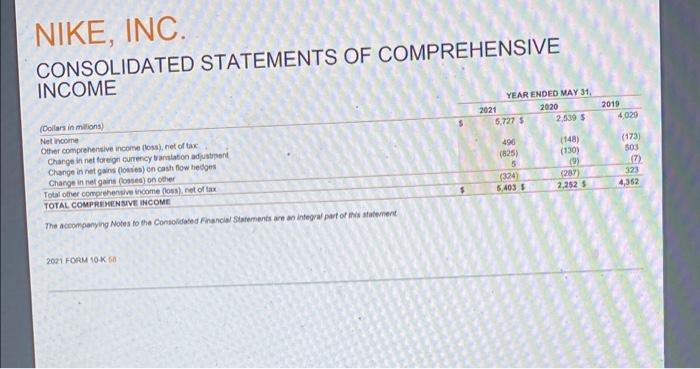
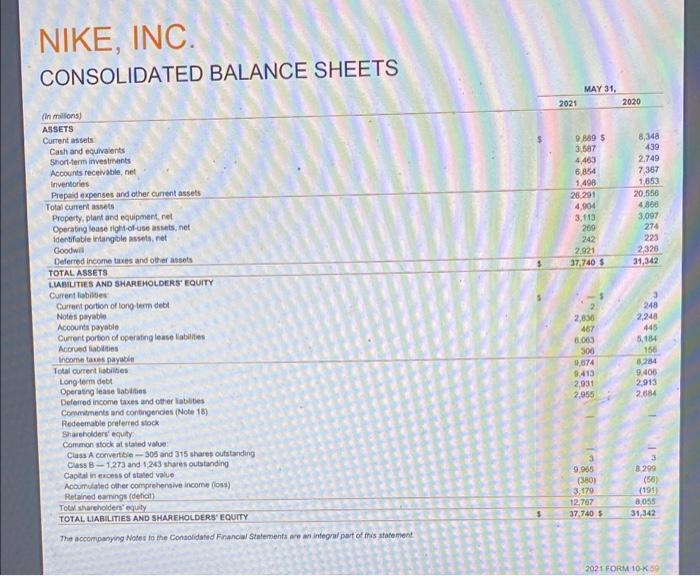
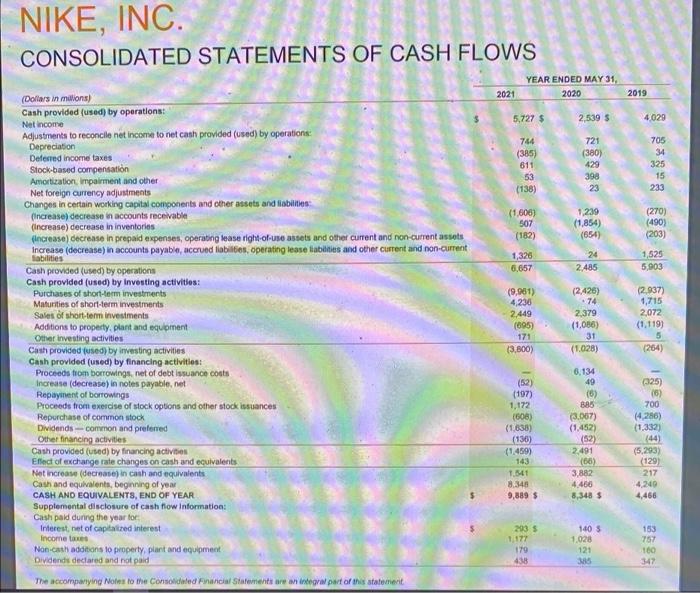
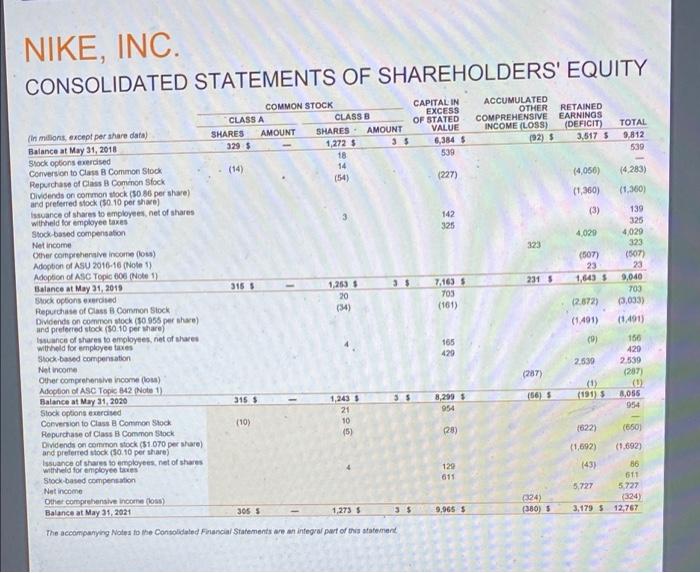
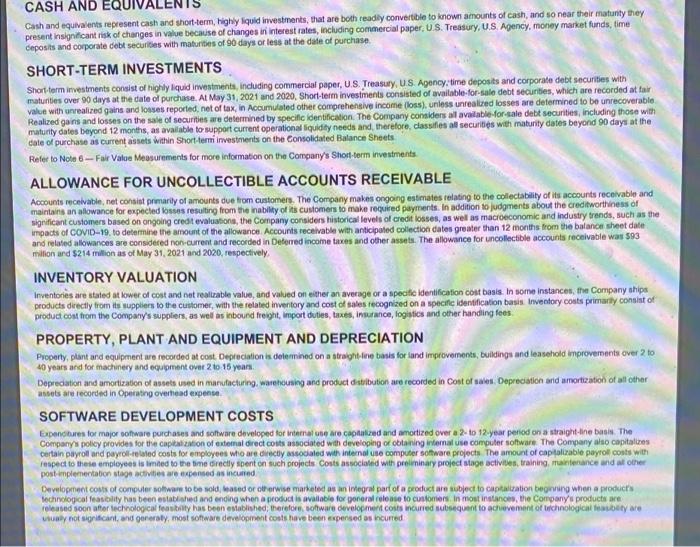
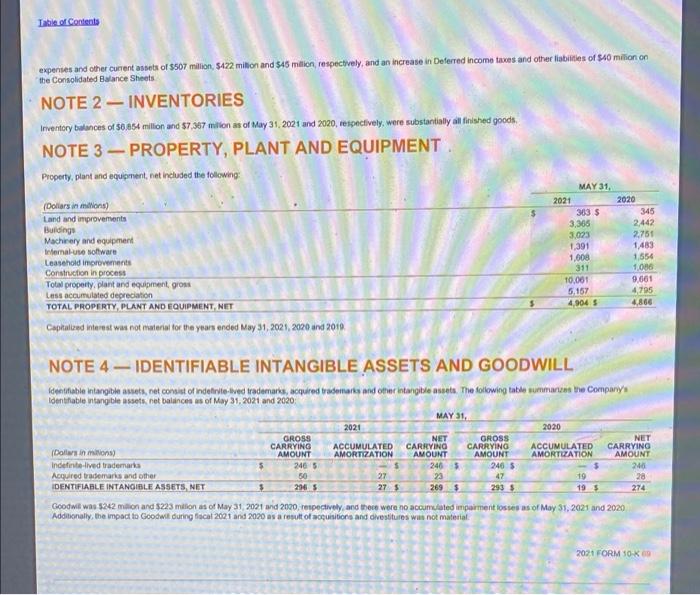
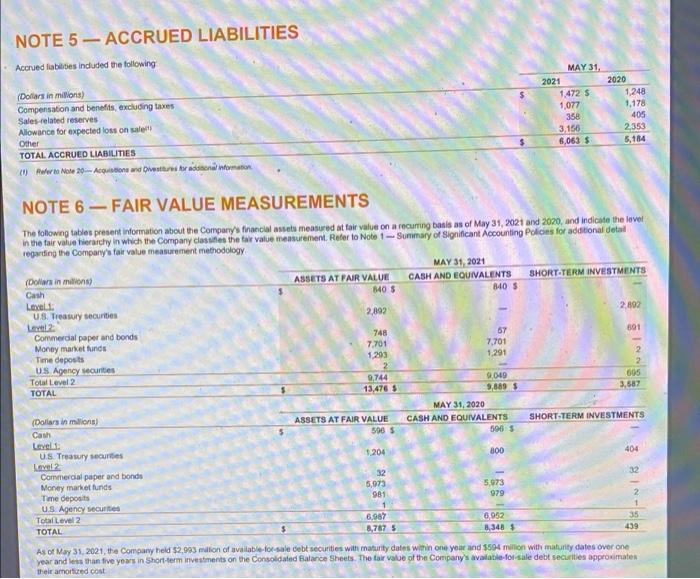
Moving to another question will save this response. estion 16 How much did Nike's revenues and gains exceed its expenses and losses during the most recent reporting period (in millions)? O a. $19,962 O b.$44,538 O c. $5,727 O d. $4,463 NIKE, CONSOLIDATED STATEMENTS OF INCOME (In millions, except per share data) 2021 Revenues $ Cost of sales Gross profit Demand creation expense Operating overhead expense Total selling and administrative expense Interest expense (income), net Other (income) expense, net Income before income taxes Income tax expense NET INCOME Earnings per common share Basic Diluted Weighted average common shares outstanding Basic Diluted The accompanying Notes to the Consolidated Financial Statements are an integral part of this statement. $ $ $ YEAR ENDED MAY 31, 2020 37,403 S 21,162 16,241 3,592 9,534 13,126 89 139 2,887 348 2,539 S 1.63 $ 1.60 S 44,538 S 24,576 19,962 3,114 9,911 13.025 262 14 6,661 934 5,727 S 3.64 $ 3.56 $ 1,573.0 1,6094 2019 39,117 21,643 17,474 3,753 8,949 12,702 49 (78) 4,801 772 4,029 2.55 2:49 1,579.7 1,618.4 2021 FORM 10-K 57 1,558.8 1,591.6 NIKE, INC. CONSOLIDATED STATEMENTS OF COMPREHENSIVE INCOME YEAR ENDED MAY 31, 2020 2021 (Dollars in millions) Net income 2,539 $ Other comprehensive income (loss), net of tax Change in net foreign currency translation adjustment Change in net gains (lossies) on cash flow hedges (148) (130) Change in net gains (losses) on other (9) (287) Total other comprehensive income (loss), net of tax TOTAL COMPREHENSIVE INCOME 2,252 S The accompanying Notes to the Consolidated Financial Statements are an integral part of this statement 2021 FORM 10-K 58 $ 5,727 S 496 (825) 5 (324) 5,403 2019 4,029 (173) 503 (7) 323 4,362 NIKE, INC. CONSOLIDATED BALANCE SHEETS (in millions) ASSETS Current assets Cash and equivalents Short-term investments Accounts receivable, net Inventories Prepaid expenses and other current assets Total current assets Property, plant and equipment, net Operating lease right-of-use assets, net Identifiable intangible assets, net Goodwill Deferred income taxes and other assets TOTAL ASSETS LIABILITIES AND SHAREHOLDERS' EQUITY Current liabilbes Current portion of long-term debl Notes payable Accounts payable Current portion of operating lease liabilities Accrued liabilities Income taxes payable Total current liabilities Long-term debt Operating lease labilities Deferred income taxes and other liabilities Commitments and contingencies (Note 18) Redeemable preferred stock Shareholders' equity Common stock at stated value: Class A convertible-305 and 315 shares outstanding Class B-1,273 and 1,243 shares outstanding Capital in excess of stated value Accumulated other comprehensive income (loss) Retained eamings (deficit) Total shareholders' equity TOTAL LIABILITIES AND SHAREHOLDERS' EQUITY The accompanying Notes to the Consolidated Financial Statements are an integral part of this statement $ S 2021 MAY 31, 9,889 S 3,587 4,463 6,854 1,498 26,291 4,904 3,113 200 242 2,921 37,740 $ 2 8,348 439 2,749 7,367 1,653 20,556 4,866 3,097 274 223 2,326 31,342 248 2,248 445 5,164 156 6,284 9,400 2,913 2,684 3 8,299 (56) (191) 8,055 31,342 2021 FORM 10-K 59 2,836 467 6.003 300 2020 9,674 9,413 2,931 2,955 3 9,965 (380) 3,170 12,767 37,740 $ NIKE, INC. CONSOLIDATED STATEMENTS OF CASH FLOWS 2021 (Dollars in millions) Cash provided (used) by operations: Net income Adjustments to reconcile net income to net cash provided (used) by operations: Depreciation Deferred income taxes Stock-based compensation Amortization, impairment and other Net foreign currency adjustments Changes in certain working capital components and other assets and liabilities: (Increase) decrease in accounts receivable (Increase) decrease in inventories (increase) decrease in prepaid expenses, operating lease right-of-use assets and other current and non-current assets Increase (decrease) in accounts payable, accrued liabilities, operating lease liabilities and other current and non-current abilities Cash provided (used) by operations Cash provided (used) by investing activities: Purchases of short-term investments Maturities of short-term investments Sales of short-term investments Additions to property, plant and equipment Other investing activities Cash provided (used) by investing activities Cash provided (used) by financing activities: Proceeds from borrowings, net of debt issuance costs Increase (decrease) in notes payable, net Repayment of borrowings Proceeds from exercise of stock options and other stock issuances Repurchase of common stock Dividends-common and preferred Other financing activities Cash provided (used) by financing activities Effect of exchange rate changes on cash and equivalents Net increase (decrease) in cash and equivalents Cash and equivalents, beginning of year CASH AND EQUIVALENTS, END OF YEAR Supplemental disclosure of cash flow Information: Cash paid during the year for Interest, net of capitalized interest Income taxes Non-cash additions to property, plant and equipment Dividends declared and not paid The accompanying Notes to the Consolidated Financial Statements are an integral part of this statement YEAR ENDED MAY 31, 2020 2,539 $ 721 (380) 429 398 23 1,239 (1,854) (654) 24 2,485 (2,426) 74 2,379 (1,086) 31 (1.028) 6,134 49 5,727 $ 744 (385) 611 53 (138) (1,606) 507 (182) 1,326 6,657 (9,961) 4,236 2,449 (695) 171 (3,800) (52) (197) 1,172 (608) (1,638) (136) (1,459) 143 1,541 8.348 9,889 $ 293 S 1,177 179 438 (6) 885 (3.067) (1,452) (52) 2,491 3,882 4.466 8,348 $ 140 S (66) 1,028 121 385 2019 4,029 705 34 325 15 233 (270) (490) (203) 1,525 5,903 (2,937) 1,715 2,072 (1,119) 5 (264) (325) (6) 700 (4,286) (1,332) (44) (5,293) (129) 217 4,249 4,466 153 757 160 347 NIKE, INC. CONSOLIDATED STATEMENTS OF SHAREHOLDERS' EQUITY COMMON STOCK CAPITAL IN ACCUMULATED CLASS A CLASS B EXCESS OF STATED OTHER RETAINED EARNINGS COMPREHENSIVE INCOME (LOSS) VALUE (DEFICIT) TOTAL SHARES AMOUNT SHARES AMOUNT 329 $ (in millions, except per share data) Balance at May 31, 2018 Stock options exercised 1,272 $ 35 6,384 9,812 (92) S 18 539 539 (14) 14 Conversion to Class B Common Stock Repurchase of Class B Common Stock (4,283) (54) (227) Dividends on common stock ($0.86 per share) and preferred stock ($0.10 per share) (1,360) Issuance of shares to employees, net of shares withheld for employee taxes 142 Stock-based compensation 325 139 325 4,029 323 Net income (507) Other comprehensive income (loss) Adoption of ASU 2016-16 (Note 1) Adoption of ASC Topic 606 (Note 1) Balance at May 31, 2019 23 1,263 S 7,163 9,040 Stock options exercised 20 703 (34) (3,033) Repurchase of Class B Common Stock Dividends on common stock (50 955 per share) and preferred stock ($0.10 per share) (1491) Issuance of shares to employees, net of shares withheld for employee taxes 156 Stock-based compensation 429 Net income 2,539 (287) Other comprehensive income (loss) Adoption of ASC Topic 842 (Note 1) Balance at May 31, 2020 315 S 1,243 (!) 8,056 954 Stock options exercised 21 Conversion to Class B Common Stock (10) 10 (5) (650) Repurchase of Class B Common Stock Dividends on common stock ($1.070 per share) and preferred stock (50.10 per share) (1,692) Issuance of shares to employees, net of shares withheld for employee taxes" Stock-based compensation 86 611 Net income 5,727 Other comprehensive income (loss) (324) Balance at May 31, 2021 305 S 1,273 S 3 $ The accompanying Notes to the Consolidated Financial Statements are an integral part of this statement 315 S 35 35 703 (161) 165 429 8,299 S 954 (28) 129 611 9,965 S 323 231 S (287) (56) S (324) (380) 3,617 S (4,056) (1,360) 6 4,029 (507) 23 1,643 (2.872) (1491) (9) 2.539 (1) (191) $ (622) (1,692) (43) 5,727 3,179 S 12,767 CASH AND EQUI Cash and equivalents represent cash and short-term, highly liquid investments, that are both readily convertible to known amounts of cash, and so near their maturity they present insignificant risk of changes in value because of changes in interest rates, including commercial paper, U.S. Treasury, U.S. Agency, money market funds, time deposits and corporate debt securities with maturities of 90 days or less at the date of purchase. SHORT-TERM INVESTMENTS Short-term investments consist of highly liquid investments, including commercial paper, U.S. Treasury, U.S. Agency, time deposits and corporate debt securities with maturities over 90 days at the date of purchase. At May 31, 2021 and 2020, Short-term investments consisted of available-for-sale debt securities, which are recorded at fair value with unrealized gains and losses reported, net of tax, in Accumulated other comprehensive income (loss), unless unrealized losses are determined to be unrecoverable. Realized gains and losses on the sale of securities are determined by specific identification. The Company considers all available-for-sale debt securities, including those with maturity dates beyond 12 months, as available to support current operational liquidity needs and, therefore, classifies all securities with maturity dates beyond 90 days at the date of purchase as current assets within Short-term investments on the Consolidated Balance Sheets Refer to Note 6-Fair Value Measurements for more information on the Company's Short-term investments ALLOWANCE FOR UNCOLLECTIBLE ACCOUNTS RECEIVABLE Accounts receivable, net consist primarily of amounts due from customers. The Company makes ongoing estimates relating to the collectability of its accounts receivable and maintains an allowance for expected losses resulting from the inability of its customers to make required payments. In addition to judgments about the creditworthiness of significant customers based on ongoing credit evaluations, the Company considers historical levels of credit losses, as well as macroeconomic and industry trends, such as the impacts of COVID-19. to determine the amount of the allowance Accounts receivable with anticipated collection dates greater than 12 months from the balance sheet date and related allowances are considered non-current and recorded in Deferred income taxes and other assets. The allowance for uncollectible accounts receivable was $93 million and $214 million as of May 31, 2021 and 2020, respectively, INVENTORY VALUATION Inventories are stated at lower of cost and net realizable value, and valued on either an average or a specific identification cost basis. In some instances, the Company ships products directly from its suppliers to the customer, with the related inventory and cost of sales recognized on a specific identification basis. Inventory costs primarily consist of product cost from the Company's suppliers, as well as inbound freight, import duties, taxes, insurance, logistics and other handling fees. PROPERTY, PLANT AND EQUIPMENT AND DEPRECIATION Property, plant and equipment are recorded at cost. Depreciation is determined on a straight-line basis for land improvements, buildings and leasehold improvements over 2 to 40 years and for machinery and equipment over 2 to 15 years. Depreciation and amortization of assets used in manufacturing, warehousing and product distribution are recorded in Cost of sales. Depreciation and amortization of all other assets are recorded in Operating overhead expense SOFTWARE DEVELOPMENT COSTS Expenditures for major software purchases and software developed for internal use are capitalized and amortized over a 2-to 12-year period on a straight-line basis. The Company's policy provides for the capitalization of external direct costs associated with developing of obtaining internal use computer software. The Company also capitalizes certain payroll and payroll-related costs for employees who are directly associated with internal use computer software projects. The amount of capitalizable payroll costs with respect to these employees is limited to the time directly spent on such projects Costs associated with preliminary project stage activities, training, maintenance and at other post-implementation stage activities are expensed as incurred Development costs of computer software to be sold, leased or otherwise marketed as an integral part of a product are subject to capitalization beginning when a product's technological feasibility has been established and ending when a product is available for general release to customers. In most instances, the Company's products are released soon after technological feasibility has been established; therefore, software development costs incurred subsequent to achievement of technological feasibility are usually not significant, and generaty, most software development costs have been expensed as incurred Table of Contents expenses and other current assets of $507 million, $422 million and $45 million, respectively, and an increase in Deferred income taxes and other liabilities of $40 milion on the Consolidated Balance Sheets NOTE 2-INVENTORIES Inventory balances of $6,854 million and $7,367 million as of May 31, 2021 and 2020, respectively, were substantially all finished goods. NOTE 3 PROPERTY, PLANT AND EQUIPMENT Property, plant and equipment, net included the following: MAY 31, (Dollars in millions) 363 $ 345 Land and improvements Buildings 3,305 2,442 3,023 2,751 Machinery and equipment. Infernal-use software 1,391 1,483 1,008 1,554 Leasehold improvements Construction in process 311 1,086 10,001 9,661 Total property, plant and equipment, gross Less accumulated depreciation 5,157 4,795 TOTAL PROPERTY, PLANT AND EQUIPMENT, NET 4,904 S 4,866 Capitalized interest was not material for the years ended May 31, 2021, 2020 and 2019. NOTE 4-IDENTIFIABLE INTANGIBLE ASSETS AND GOODWILL identifiable intangible assets, net consist of indefinite-lived trademarks, acquired trademarks and other intangible assets. The following table summarizes the Company's Identifiable intangible assets, net balances as of May 31, 2021 and 2020 MAY 31, 2021 2020 NET GROSS CARRYING AMOUNT (Dollars in mitions) GROSS CARRYING AMOUNT 240 $ 47 ACCUMULATED AMORTIZATION CARRYING AMOUNT Indefinite-lived trademarks $ NET ACCUMULATED CARRYING AMORTIZATION AMOUNT 246 $ 23 269 $ 246 246 5 50 296 5 Acquired trademarks and other 28 27 27 $ 19 19 $ $ 293 5 274 IDENTIFIABLE INTANGIBLE ASSETS, NET Goodwill was $242 million and $223 million as of May 31, 2021 and 2020, respectively, and there were no accumulated impairment losses as of May 31, 2021 and 2020 Additionally, the impact to Goodwill during flacal 2021 and 2020 as a result of acquisitions and divestitures was not material. 2021 FORM 10-K09 2021 2020 NOTE 5-ACCRUED LIABILITIES Accrued liabilities included the following (Dollars in millions) 1,472 S 1,248 Compensation and benefits, excluding taxes Sales-related reserves 1,077 1,178 358 405 Allowance for expected loss on sale 3,156 2,353 Other $ TOTAL ACCRUED LIABILITIES 5,184 6,063 $ (1) Refer to Note 20-Acquisitions and Divestures for addisonal information NOTE 6-FAIR VALUE MEASUREMENTS The following tables present information about the Company's financial assets measured at fair value on a recurring basis as of May 31, 2021 and 2020, and indicate the level in the fair value hierarchy in which the Company classifies the fair value measurement. Refer to Note 1-Summary of Significant Accounting Policies for additional detail regarding the Company's fair value measurement methodology MAY 31, 2021 (Dollars in millions) ASSETS AT FAIR VALUE CASH AND EQUIVALENTS 840 S SHORT-TERM INVESTMENTS 840 S Cash Level1: U.S. Treasury securities 2,892 2,892 Level 2 748 67 691 Commercial paper and bonds Money market funds 7,701 7,701 Time deposits 1,293 1,291 2 US Agency securities Total Level 2 TOTAL 9,744 13,476 S 9,049 9,889 $ (Dollars in millions) MAY 31, 2020 CASH AND EQUIVALENTS ASSETS AT FAIR VALUE 506 S Cash 500 S Level 1: U.S. Treasury securities 1,204 800 Level 2 Commercial paper and bonds 32 Money market funds 5,973 5,973 Time deposits 981 979 1 U.S. Agency securites Total Level 2 6,987 8,787 S TOTAL 6,952 8,348 $ 439 As of May 31, 2021, the Company held $2,993 million of available-for-sale debt securities with maturity dates within one year and $594 million with maturity dates over one year and less than five years in Short-term investments on the Consolidated Balance Sheets. The fair value of the Company's available-for-sale debt securities approximates their amortized cost 2021 MAY 31, 2020 2 2 695 3,687 SHORT-TERM INVESTMENTS 404 1
Step by Step Solution
There are 3 Steps involved in it

Get step-by-step solutions from verified subject matter experts