

Question: Question 1 In this question, you will need to provide the R-codes used and the various relevant outguts from R. (3) Apply R to simulate
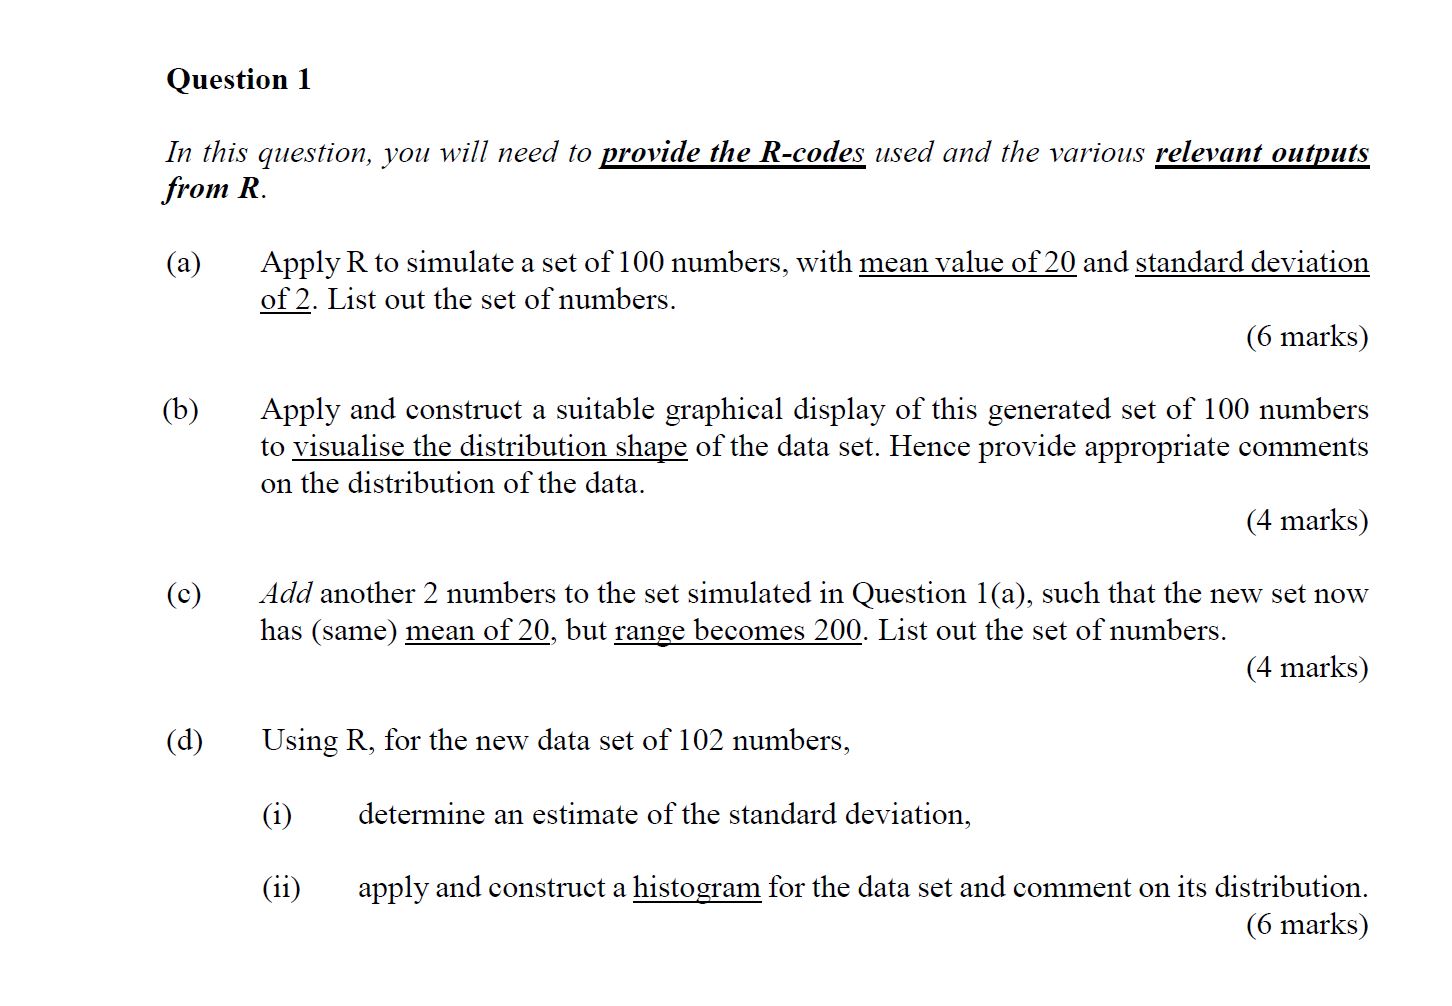
Question 1 In this question, you will need to provide the R-codes used and the various relevant outguts from R. (3) Apply R to simulate a set of 100 numbers, with mean value of 20 and standard deviation of_2. List out the set of numbers. (6 marks) (b) Apply and construct a suitable graphical display of this generated set of 100 numbers to visualise the distribution shape of the data set. Hence provide appropriate comments on the distribution of the data. (4 marks) (0) Add another 2 numbers to the set simulated in Question 1(a), such that the new set now has (same) mean of 20, but range becomes 200. List out the set of numbers. (4 marks) ((1) Using R, for the new data set of 102 numbers, (i) determine an estimate of the standard deviation, (ii) apply and construct a histogram for the data set and comment on its distribution. (6 marks)
Step by Step Solution
There are 3 Steps involved in it

Get step-by-step solutions from verified subject matter experts