

Question: question 1. Listed below are annual data for various years, The data are weights (metric tons) of imported lemons and car crash fatality rates per
question 1.
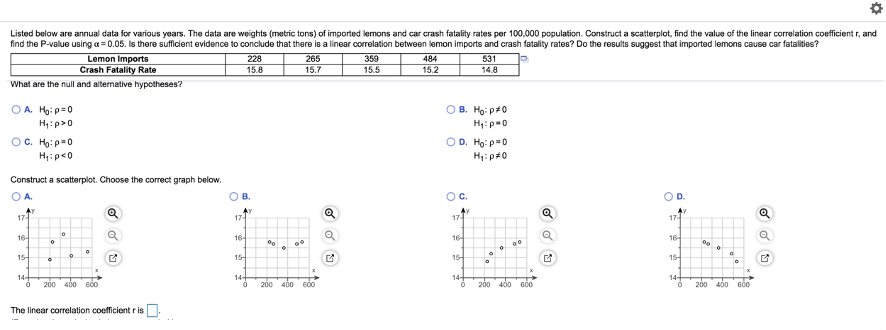
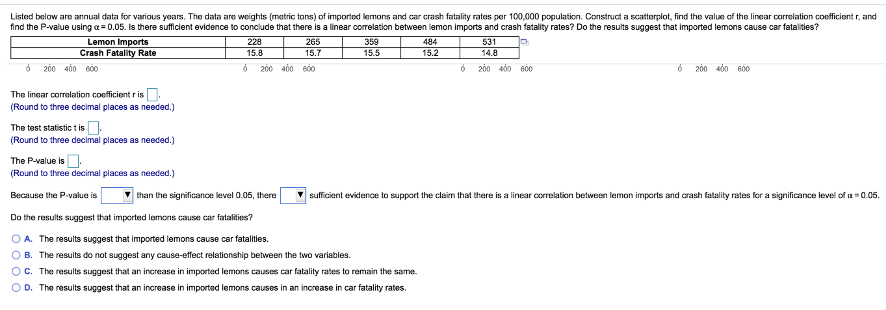

Listed below are annual data for various years, The data are weights (metric tons) of imported lemons and car crash fatality rates per 100,000 population. Construct a scatterplot, find the value of the linear correlation coefficient r, and find the P-value using 0 H1:p-D O C. Hip= 0 O D. Ho: P= 0 Hip
Step by Step Solution
There are 3 Steps involved in it
1 Expert Approved Answer
Step: 1 Unlock

Question Has Been Solved by an Expert!
Get step-by-step solutions from verified subject matter experts
Step: 2 Unlock
Step: 3 Unlock