

Question: T=? 10.1.19-T Question Help Listed below are annual data for various years. The data are weights (metric tons) of imported lemons and car crash fatality
T=?
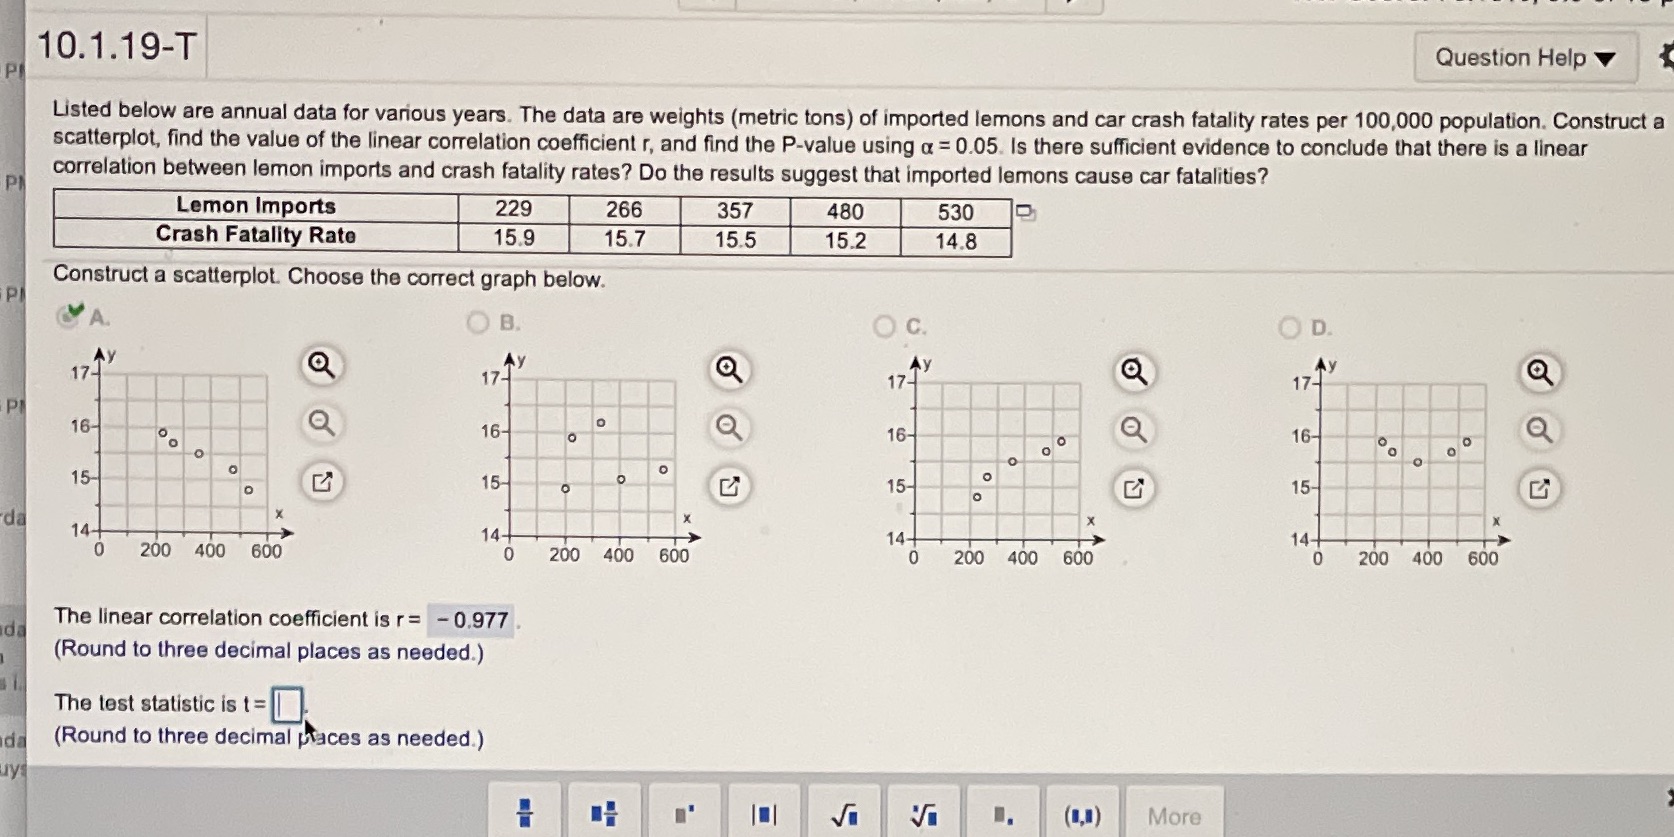
10.1.19-T Question Help Listed below are annual data for various years. The data are weights (metric tons) of imported lemons and car crash fatality rates per 100,000 population. Construct a scatterplot, find the value of the linear correlation coefficient r, and find the P-value using a = 0.05. Is there sufficient evidence to conclude that there is a linear PI correlation between lemon imports and crash fatality rates? Do the results suggest that imported lemons cause car fatalities? Lemon Imports 229 266 357 480 530 Crash Fatality Rate 15.9 15.7 15.5 15.2 14.8 PI Construct a scatterplot. Choose the correct graph below. OB. O C. OD. 17- 12 My 17 My 16- 16- O O O 16- O 16- o o 15- O 15- 15- O 15- da X 14+ X 0 200 400 600 14+ 200 400 600 14+ 0 200 400 600 14+ 0 200 400 600 da The linear correlation coefficient is r= - 0.977. (Round to three decimal places as needed.) The test statistic is t = da (Round to three decimal places as needed.) uys 101 Vi Vi I. (1,!) More
Step by Step Solution
There are 3 Steps involved in it

Get step-by-step solutions from verified subject matter experts