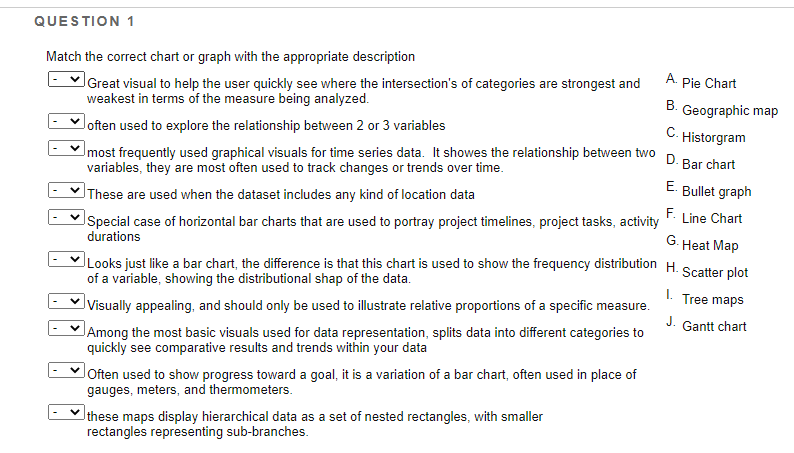
Question: QUESTION 1 Match the correct chart or graph with the appropriate description A. Pie Chart Great visual to help the user quickly see where the

QUESTION 1 Match the correct chart or graph with

QUESTION 1 Match the correct chart or graph with the appropriate description A. Pie Chart Great visual to help the user quickly see where the intersection's of categories are strongest and weakest in terms of the measure being analyzed. B. Geographic map often used to explore the relationship between 2 or 3 variables C. Historgram most frequently used graphical visuals for time series data. It showes the relationship between two D Bar chart variables, they are most often used to track changes or trends over time. E. Bullet graph These are used when the dataset includes any kind of location data F Line Chart Special case of horizontal bar charts that are used to portray project timelines, project tasks, activity durations G. Heat Map Looks just like a bar chart, the difference is that this chart is used to show the frequency distribution H. Scatter plot of a variable, showing the distributional shap of the data. I. Tree maps Visually appealing, and should only be used to illustrate relative proportions of a specific measure. J. Gantt chart Among the most basic visuals used for data representation, splits data into different categories to quickly see comparative results and trends within your data Often used to show progress toward a goal, it is a variation of a bar chart, often used in place of gauges, meters, and thermometers. these maps display hierarchical data as a set of nested rectangles, with smaller rectangles representing sub-branches

Step by Step Solution

There are 3 Steps involved in it

1 Expert Approved Answer
Step: 1 Unlock blur-text-image
Question Has Been Solved by an Expert!

Get step-by-step solutions from verified subject matter experts

Step: 2 Unlock
Step: 3 Unlock

Students Have Also Explored These Related General Management Questions!