

Question: Question 1: P chart We play M&M fun size candy bag game for the p chart. We assume each candy bag has 20 chocolates. We
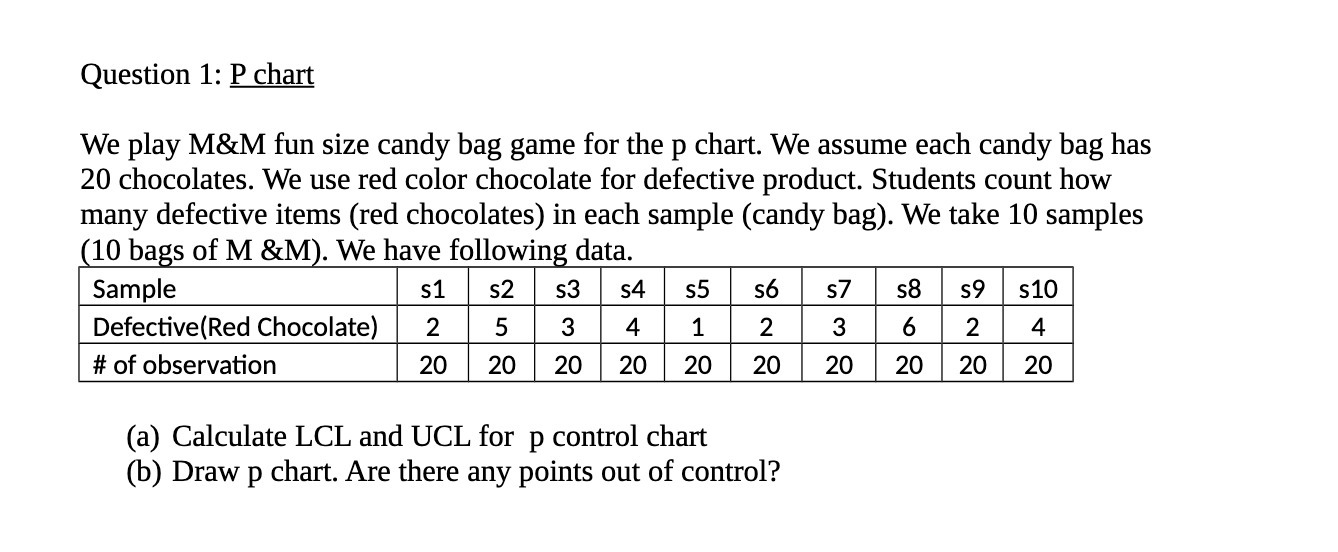
Question 1: P chart We play M&M fun size candy bag game for the p chart. We assume each candy bag has 20 chocolates. We use red color chocolate for defective product. Students count how many defective items (red chocolates) in each sample (candy bag). We take 10 samples (10 bags of M &M). We have following data. Sample $1 $2 $3 Defective(Red Chocolate) $4 $5 $6 $7 $8 2 5 $9 3 $10 4 # of observation 1 2 3 6 20 20 2 4 20 20 20 20 20 20 20 20 (a) Calculate LCL and UCL for p control chart (b) Draw p chart. Are there any points out of control
Step by Step Solution
There are 3 Steps involved in it
1 Expert Approved Answer
Step: 1 Unlock

Question Has Been Solved by an Expert!
Get step-by-step solutions from verified subject matter experts
Step: 2 Unlock
Step: 3 Unlock