

Question: Question 1 Please show excel calculations and formula! Expected returns Stocks A and B have the following probability distributions of expected future returns: a. Calculate
Question 1
Please show excel calculations and formula!
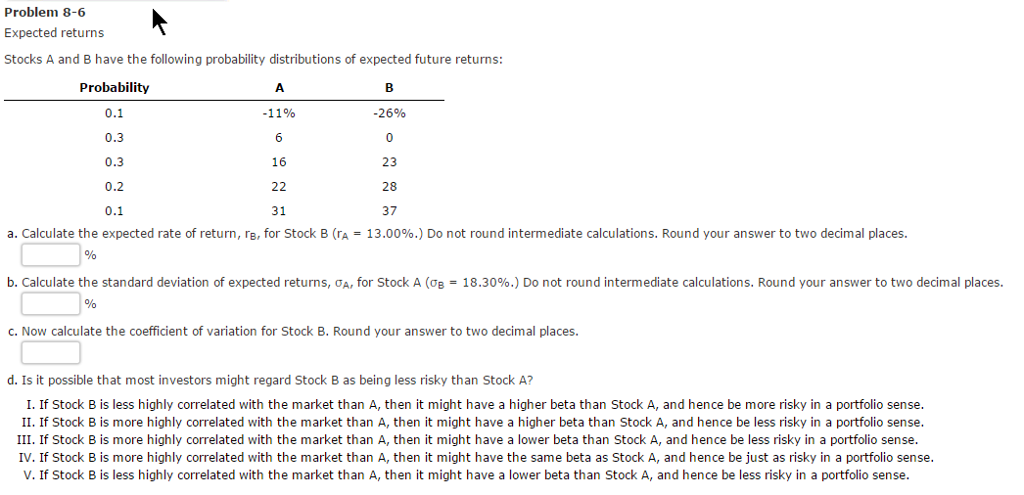
Expected returns Stocks A and B have the following probability distributions of expected future returns: a. Calculate the expected rate of return, r_B, for Stock B (r_A = 13.00%.) Do not round intermediate calculations. % b. Calculate the standard deviation of expected returns, sigma_A, for Stock A (sigma_B = 18.30%.) Do not round intermediate calculations. % c. Now calculate the coefficient of variation for Stock B. d. Is it possible that most investors might regard Stock B as being less risky than Stock A? I. If Stock B is less highly correlated with the market than A, then it might have a higher beta than Stock A, and hence be more risky in a portfolio sense. II. If Stock B is more highly correlated with the market than A, then it might have a higher beta than Stock A, and hence be less risky in a portfolio sense. III. If Stock B is more highly correlated with the market than A, then it might have a lower beta than Stock A, and hence be less risky in a portfolio sense. IV. If Stock B is more highly correlated with the market than A, then it might have the same beta as Stock A, and hence be just as risky in a portfolio sense. V. If Stock B is less highly correlated with the market than A, then it might have a lower beta than Stock A, and hence be less risky in a portfolio sense
Step by Step Solution
There are 3 Steps involved in it

Get step-by-step solutions from verified subject matter experts