

Question: Question 1 Quasml (20 marks) The table below shows the production possibilities for Product X and Product Y for a hypothetical country. 1.1 Illustrate the
Question 1
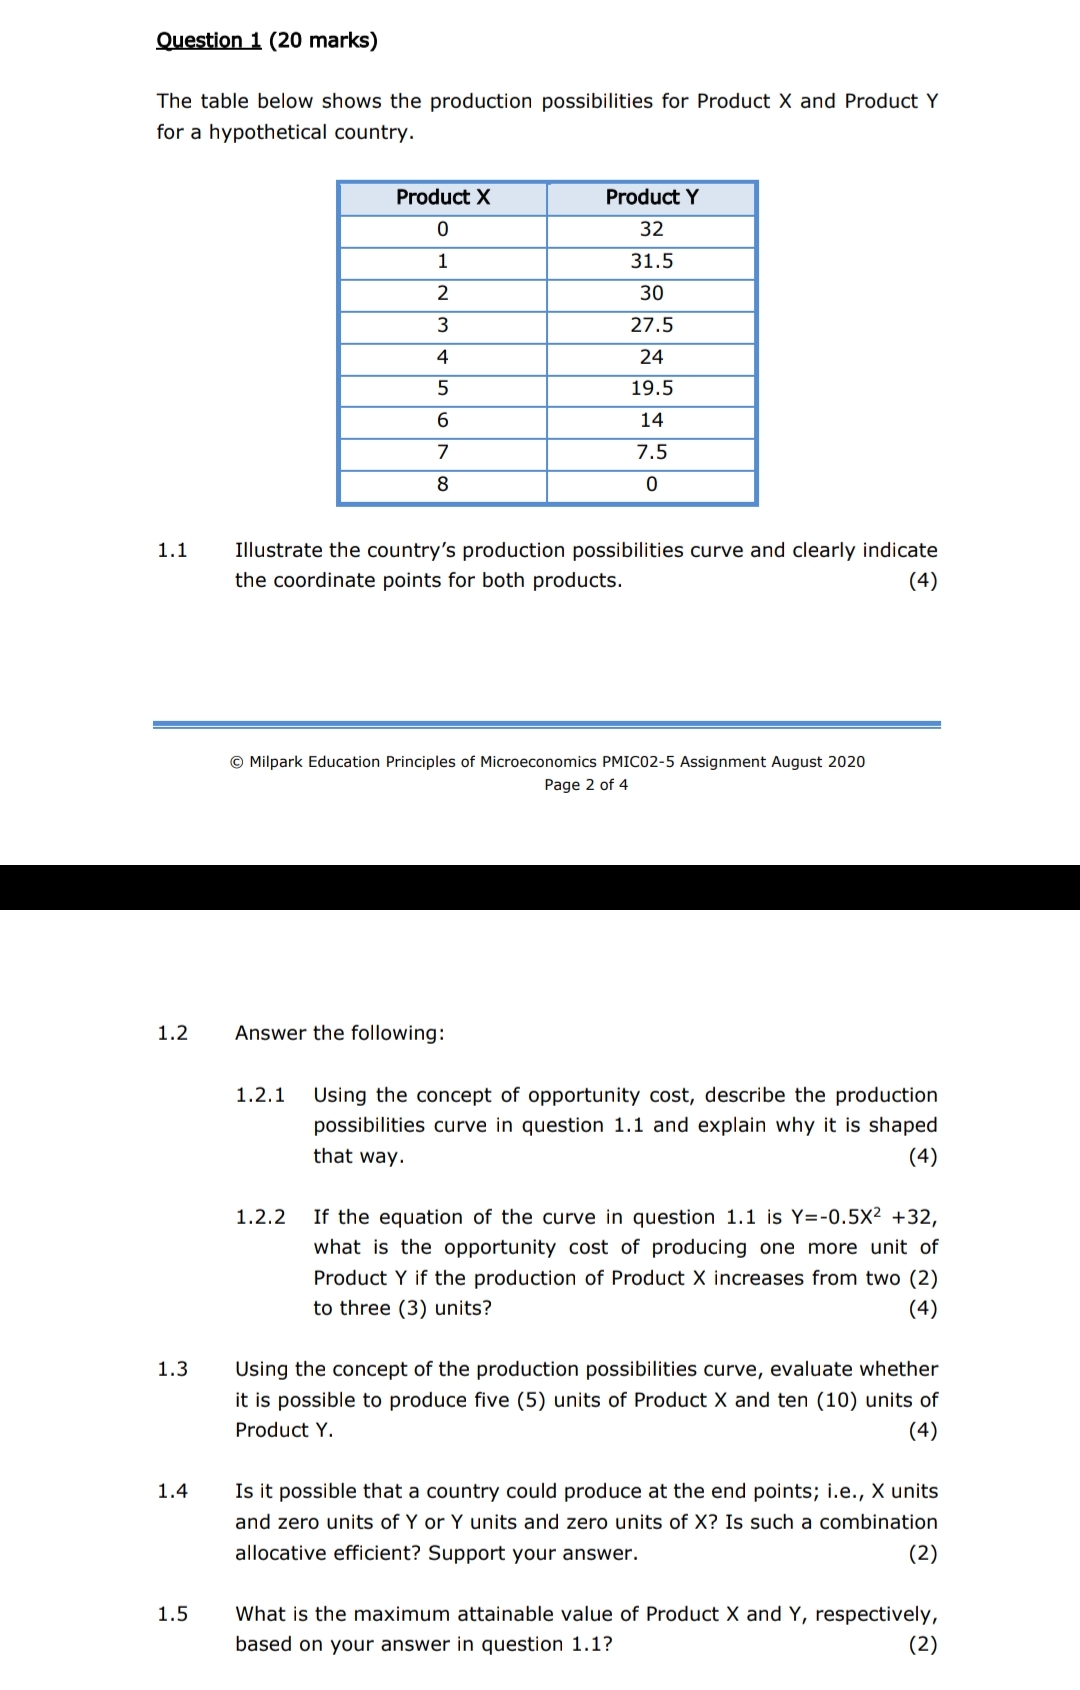
Quasml (20 marks) The table below shows the production possibilities for Product X and Product Y for a hypothetical country. 1.1 Illustrate the cou ntry's production possibilities curve and clearly indicate the coordinate points for both products. (4) Milpark Education Principles of Microeconomics PMIC2-5 Assignment August 2020 Page 2 of 4 1.2 Answer the following: 1.2.1 Using the concept of opportunity cost, describe the production possibilities curve in question 1.1 and explain why it is shaped that way. (4) 1.2.2 If the equation of the curve in question 1.1 is Y=-0.5>(2 +32, what is the opportunity cost of producing one more unit of Product Y if the production of Product X increases from two (2) to three (3) units? (4) 1.3 Using the concept of the production possibilities curve, evaluate whether it is possible to produce ve (5) units of Product x and ten (10) units of Product Y. (4) 1.4 Is it possible that a country could produce at the end points; i.e., X units and zero units of Y or Y units and zero units of X? Is such a combination allocative efficient? Support your answer. (2) 1.5 What is the maximum attainable value of Product X and Y, respectively, based on your answer in question 1.1? (2)
Step by Step Solution
There are 3 Steps involved in it

Get step-by-step solutions from verified subject matter experts