

Question: Question 1 Question 2 The Ideal Spot in the Segment Circles Ideal Spots offset from segment center So, where should you try to position your
Question 1
Question 2
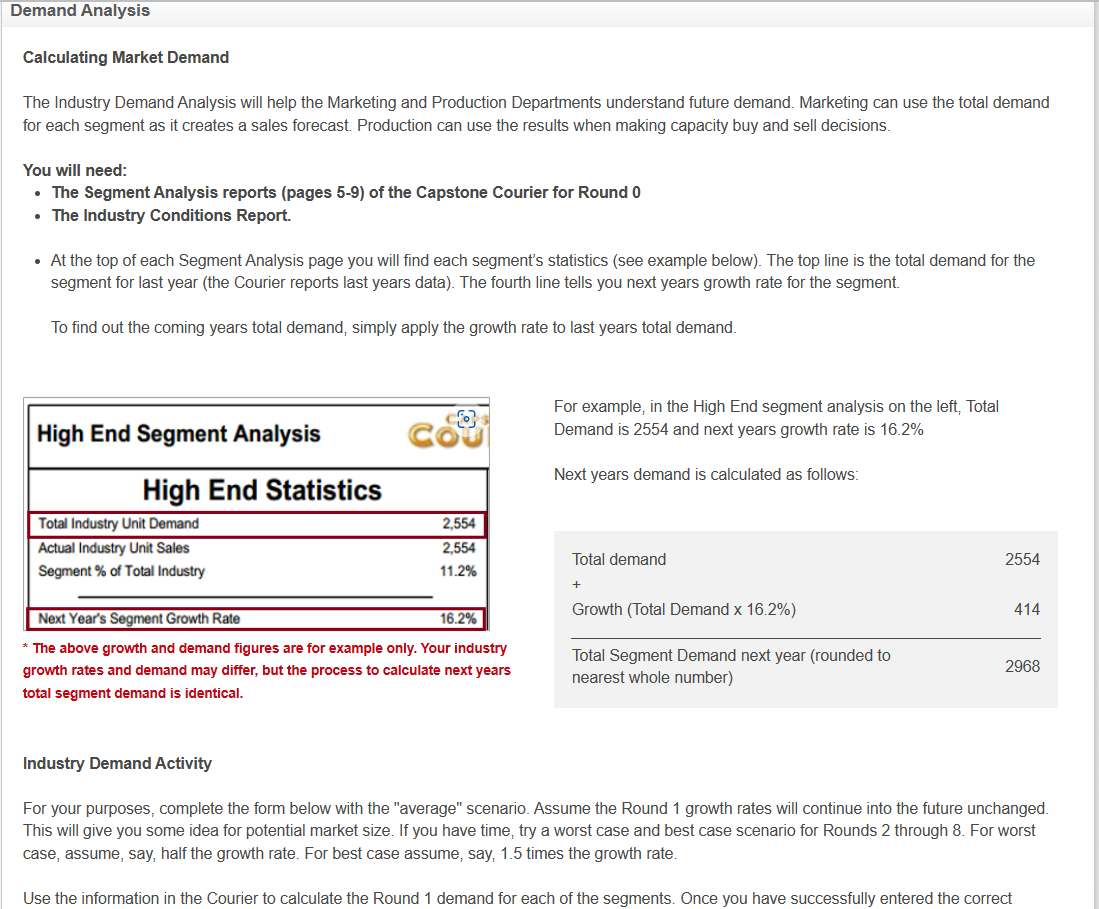
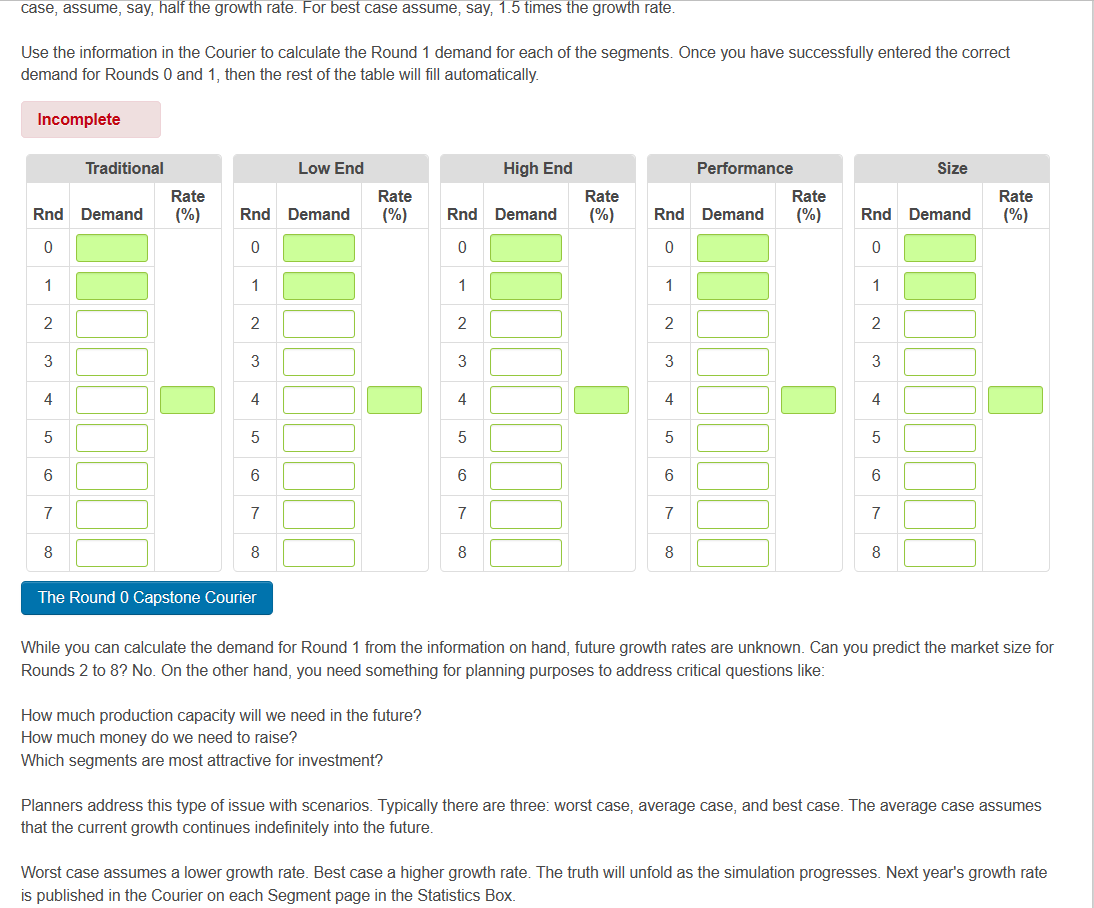
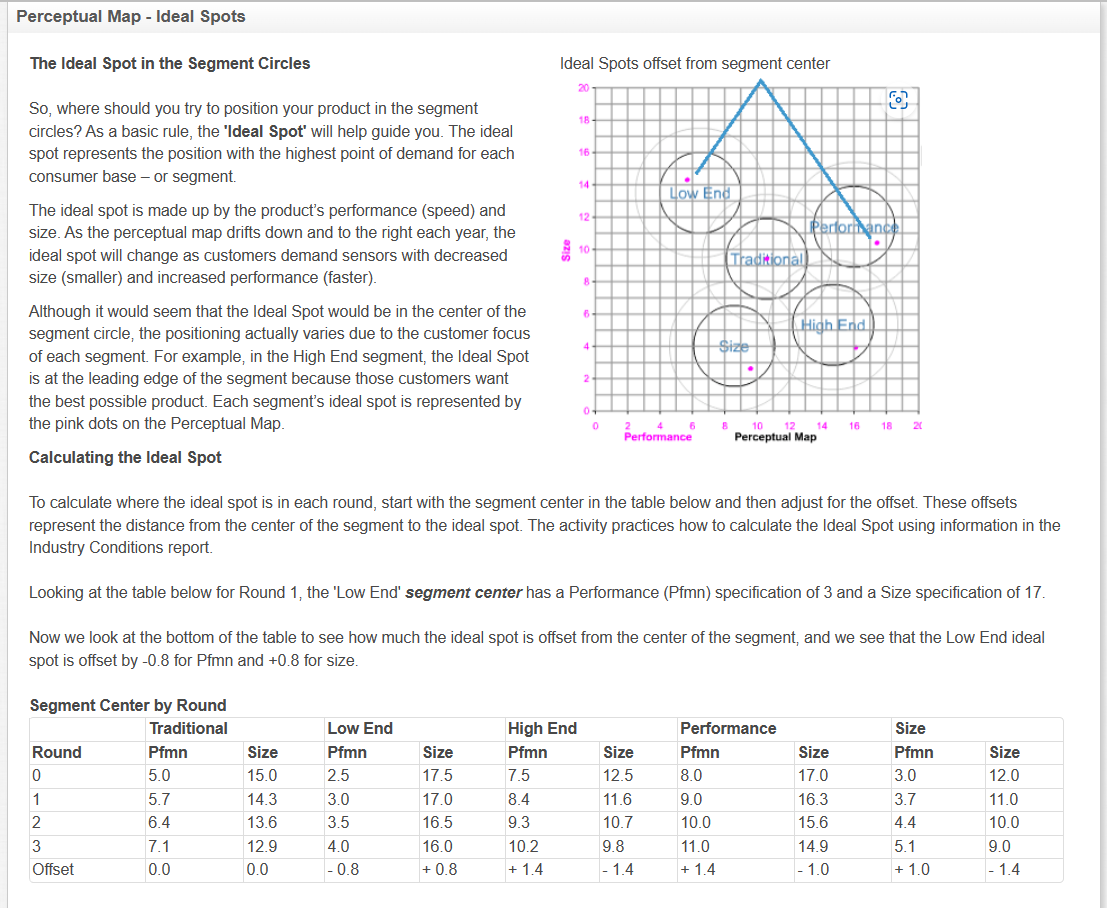
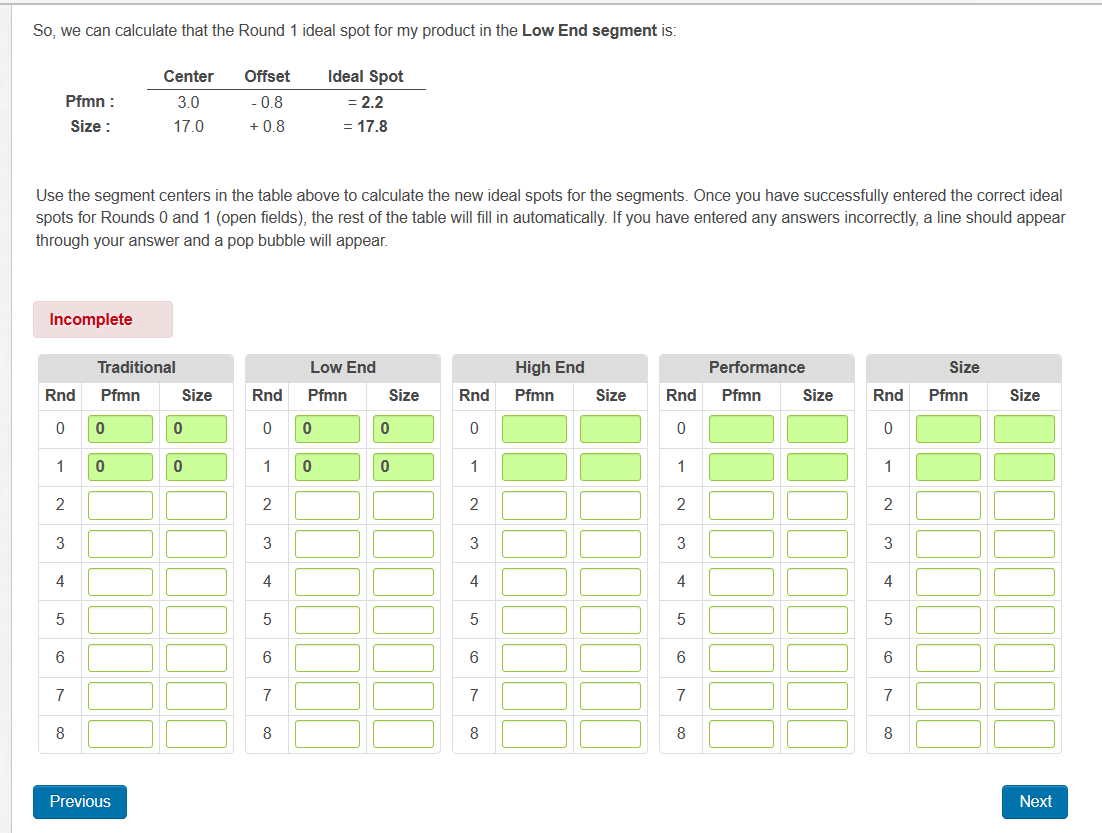
The Ideal Spot in the Segment Circles Ideal Spots offset from segment center So, where should you try to position your product in the segment circles? As a basic rule, the 'Ideal Spot' will help guide you. The ideal spot represents the position with the highest point of demand for each consumer base - or segment. The ideal spot is made up by the product's performance (speed) and size. As the perceptual map drifts down and to the right each year, the ideal spot will change as customers demand sensors with decreased size (smaller) and increased performance (faster). Although it would seem that the Ideal Spot would be in the center of the segment circle, the positioning actually varies due to the customer focus of each segment. For example, in the High End segment, the Ideal Spot is at the leading edge of the segment because those customers want the best possible product. Each segment's ideal spot is represented by the pink dots on the Perceptual Map. Calculating the Ideal Spot To calculate where the ideal spot is in each round, start with the segment center in the table below and then adjust for the offset. These offsets represent the distance from the center of the segment to the ideal spot. The activity practices how to calculate the Ideal Spot using information in the Industry Conditions report. Looking at the table below for Round 1, the 'Low End' segment center has a Performance (Pfmn) specification of 3 and a Size specification of 17. Now we look at the bottom of the table to see how much the ideal spot is offset from the center of the segment, and we see that the Low End ideal spot is offset by 0.8 for Pfmn and +0.8 for size. So, we can calculate that the Round 1 ideal spot for my product in the Low End segment is: Use the segment centers in the table above to calculate the new ideal spots for the segments. Once you have successfully entered the correct ideal spots for Rounds 0 and 1 (open fields), the rest of the table will fill in automatically. If you have entered any answers incorrectly, a line should appear through your answer and a pop bubble will appear. Calculating Market Demand The Industry Demand Analysis will help the Marketing and Production Departments understand future demand. Marketing can use the total demand for each segment as it creates a sales forecast. Production can use the results when making capacity buy and sell decisions. You will need: - The Segment Analysis reports (pages 5-9) of the Capstone Courier for Round 0 - The Industry Conditions Report. - At the top of each Segment Analysis page you will find each segment's statistics (see example below). The top line is the total demand for the segment for last year (the Courier reports last years data). The fourth line tells you next years growth rate for the segment. To find out the coming years total demand, simply apply the growth rate to last years total demand. For example, in the High End segment analysis on the left, Total Demand is 2554 and next years growth rate is 16.2% Next years demand is calculated as follows: The above growth and demand figures are for example only. Your industry growth rates and demand may differ, but the process to calculate next years total segment demand is identical. Industry Demand Activity For your purposes, complete the form below with the "average" scenario. Assume the Round 1 growth rates will continue into the future unchanged. This will give you some idea for potential market size. If you have time, try a worst case and best case scenario for Rounds 2 through 8 . For worst case, assume, say, half the growth rate. For best case assume, say, 1.5 times the growth rate. Use the information in the Courier to calculate the Round 1 demand for each of the segments. Once you have successfully entered the correct case, assume, say, half the growth rate. For best case assume, say, 1.5 times the growth rate. Use the information in the Courier to calculate the Round 1 demand for each of the segments. Once you have successfully entered the correct demand for Rounds 0 and 1 , then the rest of the table will fill automatically. While you can calculate the demand for Round 1 from the information on hand, future growth rates are unknown. Can you predict the market size for Rounds 2 to 8 ? No. On the other hand, you need something for planning purposes to address critical questions like: How much production capacity will we need in the future? How much money do we need to raise? Which segments are most attractive for investment? Planners address this type of issue with scenarios. Typically there are three: worst case, average case, and best case. The average case assumes that the current growth continues indefinitely into the future. Worst case assumes a lower growth rate. Best case a higher growth rate. The truth will unfold as the simulation progresses. Next year's growth rate is published in the Courier on each Segment page in the Statistics Box
Step by Step Solution
There are 3 Steps involved in it

Get step-by-step solutions from verified subject matter experts