

Question: Question 1 Questions 1-6. The table below represents the monthly unemployment rates in the US from January of 2005 through May of 2016. Year Jan
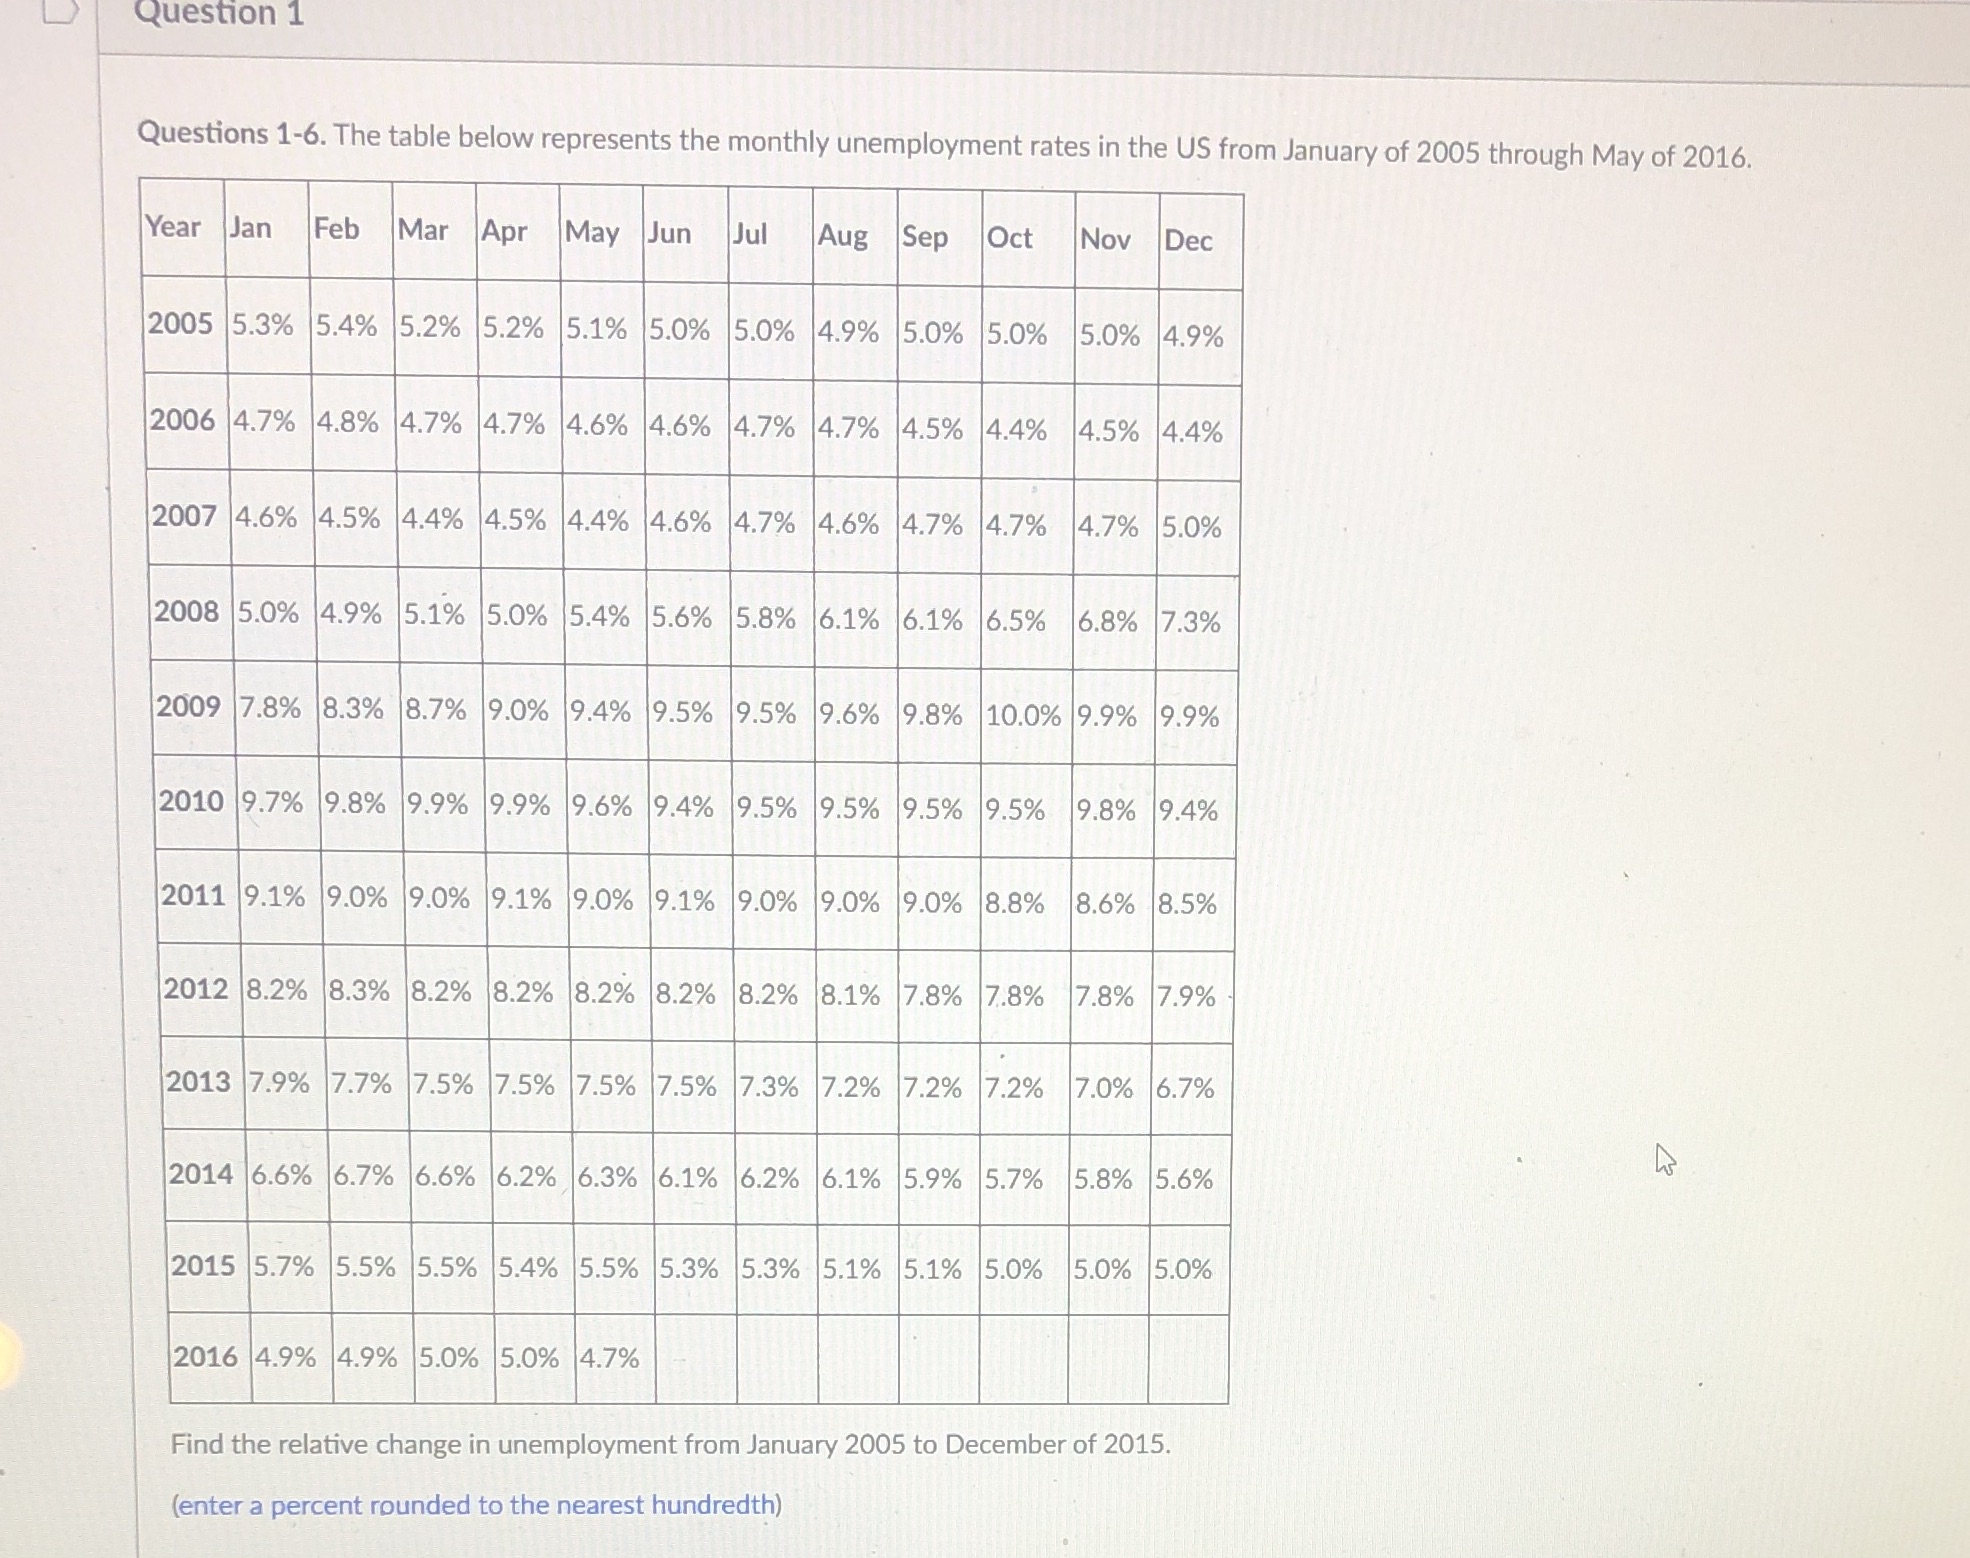
Question 1 Questions 1-6. The table below represents the monthly unemployment rates in the US from January of 2005 through May of 2016. Year Jan Feb Mar Apr May Jun Jul Aug Sep Oct Nov Dec 2005 5.3% 5.4% 5.2% 5.2% 5.1% 5.0% 5.0% 4.9% 5.0% 5.0% 5.0% 4.9% 2006 4.7% 4.8% 4.7% 4.7% 4.6% 4.6% 4.7% 4.7% 4.5% 4.4% 4.5% 4.4% 2007 4.6% 4.5% 4.4% 4.5% 4.4% 4.6% 4.7% 4.6% 4.7% 4.7% 4.7% 5.0% 2008 5.0% 4.9% 5.1% 5.0% 5.4% 5.6% 5.8% 6.1% 6.1% 6.5% 6.8% 7.3% 2009 7.8% 8.3% 8.7% 9.0% 9.4% 9.5% 9.5% 9.6% 9.8% 10.0% 9.9% 9.9% 2010 9.7% 9.8% 9.9% 9.9% 9.6% 9.4% 9.5% 9.5% 9.5% 9.5% 9.8% 9.4% 2011 9.1% 9.0% 9.0% 9.1% 9.0% 9.1% 9.0% 9.0% 9.0% 8.8% 8.6% 8.5% 2012 8.2% 8.3% 8.2% 8.2% 8.2% 8.2% 8.2% 8.1% 7.8% 7.8% 7.8% 7.9% 2013 7.9% 7.7% 7.5% 7.5% 7.5% 7.5% 7.3% 7.2% 7.2% 7.2% 7.0% 6.7% 2014 6.6% 6.7% 6.6% 6.2% 6.3% 6.1% 6.2% 6.1% 5.9% 5.7% 5.8% 5.6% 2015 5.7% 5.5% 5.5% 5.4% 5.5% 5.3% 5.3% 5.1% 5.1% 5.0% 5.0% 5.0% 2016 4.9% 4.9% 5.0% 5.0% 4.7% Find the relative change in unemployment from January 2005 to December of 2015. (enter a percent rounded to the nearest hundredth)
Step by Step Solution
There are 3 Steps involved in it

Get step-by-step solutions from verified subject matter experts