

Question: Question 1 TABLE 1 contains the production possibilities data for capital goods and consumer goods in the economy of New Harmony. Capital goods 0 Consumer
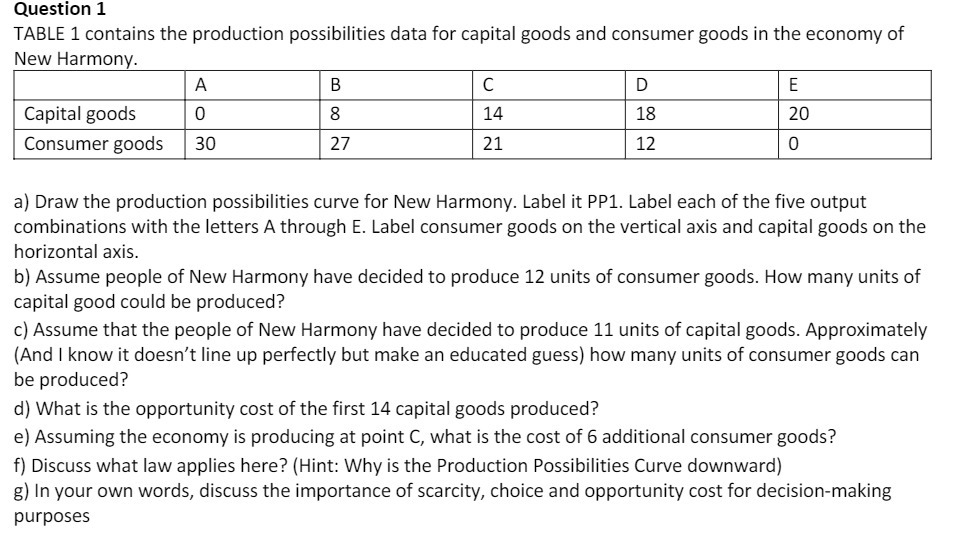
Question 1 TABLE 1 contains the production possibilities data for capital goods and consumer goods in the economy of New Harmony. Capital goods 0 Consumer goods 30 a} Draw the production possibilities curve for New Harmony. Label it PP1. Label each of the ve output combinations with the letters A through E. Label consumer goods on the vertical axis and capital goods on the horizontal axis. b] Assume people of New Harmony have decided to produce 12 units of consumer goods. How many units of capital good could be produced? c} Assume that the people of New Harmony have decided to produce 11 units of capital goods. Approximately (And I know it doesn't line up perfectly but make an educated guess) how many units of consumer goods can be produced? d} What is the opportunity cost ofthe first 14 capital goods produced? e) Assuming the economy is producing at point C, what is the cost of 6 additional consumer goods? 1') Discuss what law applies here? {Hint Why is the Production Possibilities Curve downward) g} In your own words, discuss the importance of scarcity, choice and opportunity cost for decision-making purposes
Step by Step Solution
There are 3 Steps involved in it

Get step-by-step solutions from verified subject matter experts